Tropical Cyclone Activity in the Western North Pacific and the South China Sea
Tropical Cyclone Activity in the Western North Pacific and the South China Sea
There is much variability from one year to another in where tropical cyclones form or dissipate over the western North Pacific and the South China Sea, as well as in which directions do they choose to move and with what speed. This is attributable to the stochasticity inherent in the atmosphere. However, long-term records do seem to show relatively 'quiet' and 'active' periods in tropical cyclone activity (see Figure below). This cyclical behaviour seems to be linked to inter-annual and inter-decadal oscillations in the atmosphere.On the inter-annual time scale, the most prominent influence on tropical cyclone activity is that due to the 3-year cycle associated with El Nino and La Nina events. That only 2 tropical cyclones affected Hong Kong during the strong El Nino event in 1997 compared to 8 during the strong La Nina event of 1999 should still be fresh in our minds. In 2002, 2003 and 2004, respectively 7, 8 and 8 tropical cyclones occurred over the northern part of the South China Sea, all below the long-term average of 12. Thus, these 3 years may be regarded as a 'quiet' period.On inter-decadal time scales, tropical cyclone activity over the western North Pacific seems to have a periodicity of about 18 years. This may be related to the Pacific Decadal Oscillation (see https://sealevel.jpl.nasa.gov/science/elninopdo/pdo/). Thus, it is likely that the periodic patterns observed in tropical cyclone activity in the western North Pacific and the South China Sea are related to the oscillations of different periods in the atmosphere.
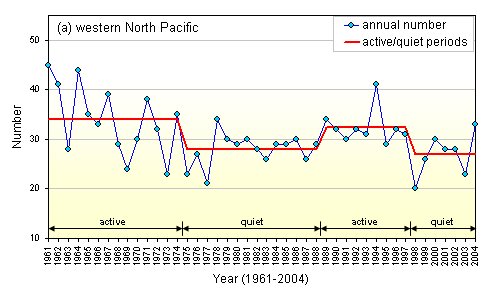
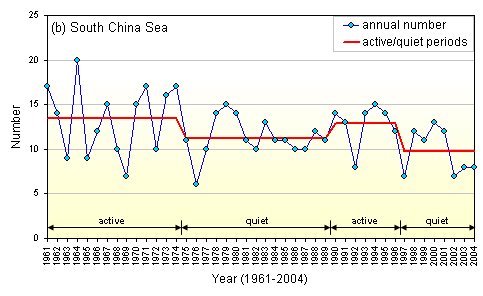
Figure 1. Time series of the annual number of tropical cyclones in the (a) western North Pacific and (b) South China Sea (10-25°N, 105-120°E).
Red lines denote the mean annual number in 'quiet' and 'active' periods.