Skip Content
Tropical Storm Mulan (2207)
Report on Tropical Storm Mulan (2207)
Figures
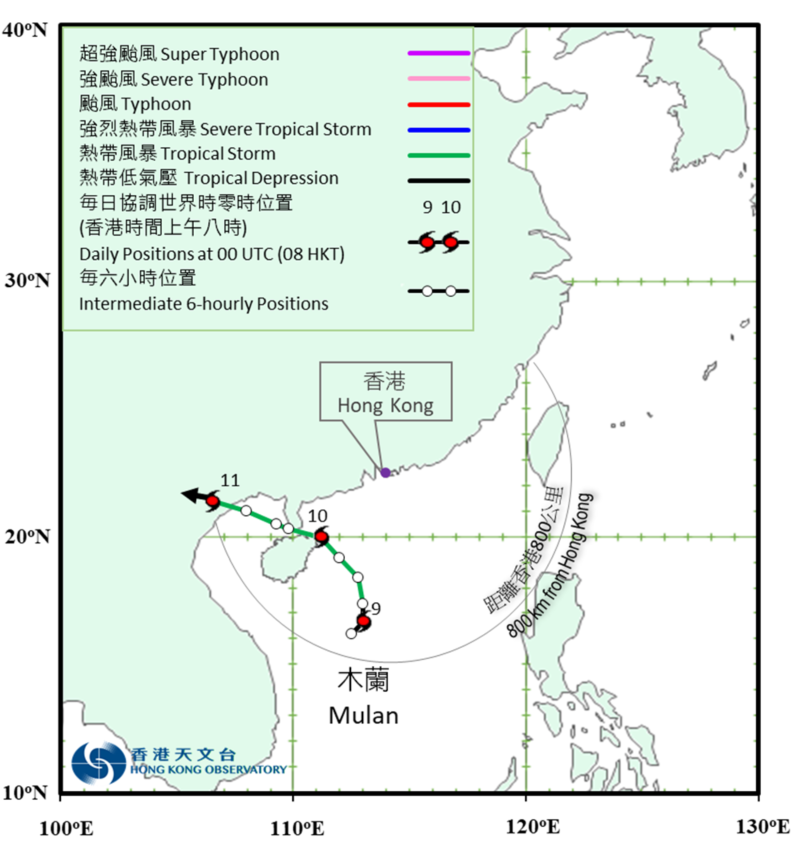
Figure 1: Provisional Track of Mulan : 9 – 11 August 2022
Figure 2: Rainfall distribution on 9 – 10 August 2022
Figure 3: 10-minute mean wind direction and speed recorded at various stations in Hong Kong at 2:40 a.m. on 10 August 2022
Figure 4: Infra-red satellite imagery around 2 a.m. on 10 August 2022
Figure 5: Image of radar echoes at 7:48 p.m. on 9 August 2022
Tables
Table 1: Maximum gust peak speeds and maximum hourly mean winds with associated wind directions recorded at various stations when the tropical cyclone warning signals for Mulan were in force
Table 2: Periods during which sustained strong winds were attained at the eight reference anemometers in the tropical cyclone warning system when tropical cyclone warning signals for Mulan were in force
Table 3: Daily rainfall amounts recorded at the Hong Kong Observatory Headquarters and other stations during the passage of Mulan
Table 4: Times and heights of the maximum sea level and the maximum storm surge recorded at tide stations in Hong Kong during the passage of Mulan