Some Statistics on UV Index
Some Statistics on UV Index
LEUNG Wai-hung
December 2009
What is UV index?
UV index is an indicator that measures the effect of solar ultraviolet radiation on human skin. The higher the index, the greater the risk of skin damage due to ultraviolet radiation. In Hong Kong, the UV index normally ranges between 0 and 15.
What are the exposure categories for different UV index values?
According to the World Health Organization, the UV index is classified as "low", "moderate", "high", "very high" and "extreme" categories based on the UV index values.
| UV index | Exposure category |
|---|---|
| 0-2 | Low |
| 3-5 | Moderate |
| 6-7 | High |
| 8-10 | Very High |
| >= 11 | Extreme |
When will the UV index attain its daily and monthly maximum values?
Figure 1 shows the diurnal values of the hourly mean UV index, based on annual and seasonal averages for the past ten years (1 August 1999 to 31 July 2009). The hourly mean UV index at 1 p.m. was highest in all seasons.
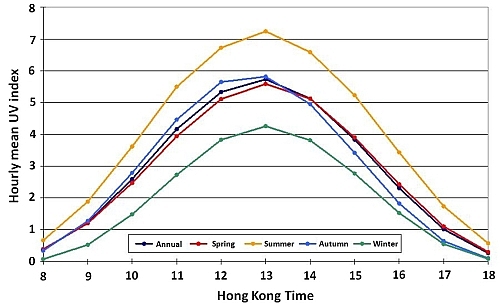
Figure 1 The annual and seasonal averaged values of hourly mean UV Index
The annual variation of the monthly mean values of UV index for the past ten years is shown in Figure 2. It can be seen that the UV index is highest in July. The diurnal and seasonal variations of the UV index are mainly due to the difference in solar elevation angle which determines the intensity of atmospheric attenuation and scattering of the solar UV radiation.
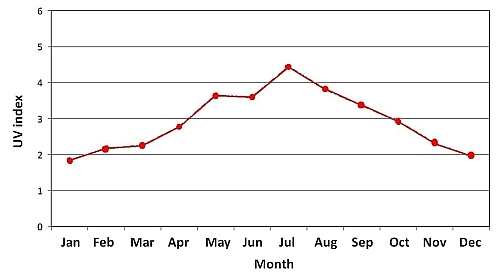
Figure 2 The average daily UV index in different months (1 August 1999 to 31 July 2009)
How are the daily maximum UV indices in different exposure categories distributed over different months?
An analysis of the UV index data from 1 August 1999 to 31 July 2009 shows that the daily maximum UV index reached the "high" or above categories for about 66% of the time. The "extreme" cases, occurring about 17% of the time, were mostly attained during the period between April and September. The detailed frequency distribution of daily maximum UV index in different exposure categories and months is shown in the following table.
| Daily maximum UV index | Jan | Feb | Mar | Apr | May | Jun | Jul | Aug | Sep | Oct | Nov | Dec | Total |
|---|---|---|---|---|---|---|---|---|---|---|---|---|---|
| Low (0-2) | 40 | 39 | 48 | 26 | 15 | 19 | 6 | 17 | 5 | 6 | 16 | 17 | 254 days |
| % | 1.1 | 1.1 | 1.3 | 0.7 | 0.4 | 0.5 | 0.2 | 0.5 | 0.1 | 0.2 | 0.4 | 0.5 | 7.0 |
| Moderate (3-5) | 186 | 87 | 83 | 81 | 38 | 43 | 27 | 36 | 43 | 43 | 101 | 224 | 992 days |
| % | 5.1 | 2.4 | 2.3 | 2.2 | 1.0 | 1.2 | 0.7 | 1.0 | 1.2 | 1.2 | 2.8 | 6.1 | 27.2 |
| High (6-7) | 80 | 101 | 94 | 50 | 40 | 37 | 32 | 34 | 49 | 138 | 168 | 69 | 892 days |
| % | 2.2 | 2.8 | 2.6 | 1.4 | 1.1 | 1.0 | 0.9 | 0.9 | 1.3 | 3.8 | 4.6 | 1.9 | 24.5 |
| Very High (8-10) | 3 | 55 | 83 | 105 | 119 | 82 | 64 | 83 | 161 | 122 | 15 | 0 | 892 days |
| % | 0.1 | 1.5 | 2.3 | 2.9 | 3.3 | 2.3 | 1.8 | 2.3 | 4.4 | 3.3 | 0.4 | 0.0 | 24.5 |
| Extreme (>=11) | 0 | 0 | 2 | 38 | 98 | 119 | 181 | 137 | 38 | 1 | 0 | 0 | 614 days |
| % | 0.0 | 0.0 | 0.1 | 1.0 | 2.7 | 3.3 | 5.0 | 3.8 | 1.0 | 0.0 | 0.0 | 0.0 | 16.8 |
Frequency distribution (number of days and percentage) of daily maximum UV index in different exposure categories and months (1 August 1999 to 31 July 2009)
How can I obtain information about UV index?
The Hong Kong Observatory has been measuring and disseminating UV index since 1999. Since 2006, the Observatory has started providing forecast of the maximum UV index for the next day. When the index is measured or forecast to be 11 or above, the Observatory will also advise the public to avoid prolonged exposure under the sun. The public can check the latest UV index through radio, television, the Observatory's website and Dial-a-Weather system (1878200).