Conveying High-impact Weather Forecasts with Uncertainties - A New Challenge for Public Communication
Conveying High-impact Weather Forecasts with Uncertainties - A New Challenge for Public Communication
YEUNG Hon-yin, LEE Kwok-lun and CHUI Ka-wing
November 2019
Characteristics of High-impact Weather
Under a warming world, different types of extreme weather are expected to occur at varying rates with an overall increasing trend. The associated high impacts that may cause enormous damages to the society and pose high risks to life and health could hardly be underestimated. Deadly heatwaves, chilling cold surges, tsunami-like storm surges, serious flooding arising from rainstorms, etc., are not uncommon to be noticed from the news every now and then.
One common feature to the above mentioned high-impact weather types is their extremity and rarity. Their occurrence frequencies are so low that past observation data associated with such phenomena have been poorly available, making scientific studies difficult. With the rapid advent of computers and remote-sensing instruments, meteorologists nowadays can employ supercomputers to handle and assimilate massive observations and simulate extreme and rare weather phenomena by repeatedly running numerical prediction models. Before each computer simulation, a number of slightly different initial conditions from the actual atmospheric analysis are drawn to simulate various possible forecast scenarios. The simulation results are then collected and processed for calculating statistics about the distributions of all possible weather regimes, including the uncertainties associated with extreme high-impact events. The forecast system mentioned above, including the underlying analysis and simulation algorithms, is commonly known as Ensemble Prediction System (EPS).
How to effectively convey to the general users the different forecast elements from an EPS, including their associated uncertainties, is of paramount importance. Yet, it has been a forbidden challenge to the meteorological community and the Observatory is of no exception. During the past few years, the Observatory has explored and developed some experimental extended forecast products based on EPS data. To unveil to the public all the possibilities and uncertainties depicted by EPS, we have abandoned the traditional worded forecasts and turned to drawing colourful pictures. Leaning on the mathematical language of probability, such a picture is worth a thousand words and better reflects the forecast distributions without much loss of fidelity as illustrated below.
Extended Forecasts for Weather Elements
The "Extended Outlook (Beta)" webpage provides the probability forecasts and evolution trends out to 14 days ahead for different weather elements, including maximum temperature, minimum temperature and mean-sea-level pressure (MSLP), in the form of coloured time series charts.
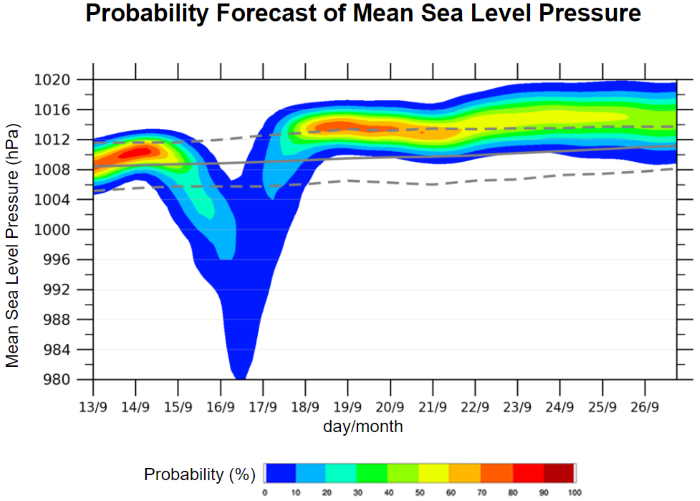
Figure 1 The MSLP probability forecast associated with the case of Super Typhoon Mangkhut in September 2018.
Figure 1 shows the MSLP probability forecast associated with the case of Super Typhoon Mangkhut in September 2018. On the chart, different colours represent different chances of pressure occurring in the marked ranges. In general, the more reddish the colour, the higher the chance. Whereas more bluish the colour, the lower the chance. The colour chart shows a pronounced signal with a finite chance of pressure dropping drastically on 16 September way below the normal climate range (grey lines), hinting that Mangkhut might be closest to Hong Kong and bringing extreme low pressure to the territory by then. Having said that, it should well be noted that such a signal was weighted with a low probability, meaning that the actual occurrence of the corresponding extreme weather was still largely a variable. As the saying goes: “never tailgating”, particularly applicable to those forecast situations plagued with uncertainty.
Tropical Cyclone Track Probability Forecast
The "Tropical Cyclone Track Probability Forecast" webpage provided by the Observatory displays the probability of a tropical cyclone (TC) passing within a certain region in the coming 9 days also in the form of a coloured diagram, enabling users to appraise the trend of TC movement in the near future.
Figure 2 shows the track probability forecast for the case of TC Podul in late August 2019. The colour codes follow those of the Extended Forecasts. The probability distribution on the map indicated that Podul located at the seas east to the Philippines at that time would have a high chance to move across Luzon first. The subsequent track probabilities decreased generally to below 50%, meaning that the track of Podul upon entering the South China Sea would become more uncertain. Overall speaking, the chance of Podul tracking westward and edging closer to the vicinity of Hainan Island was still relatively high, while that of affecting the vicinity of the Pearl River Estuary region was low.
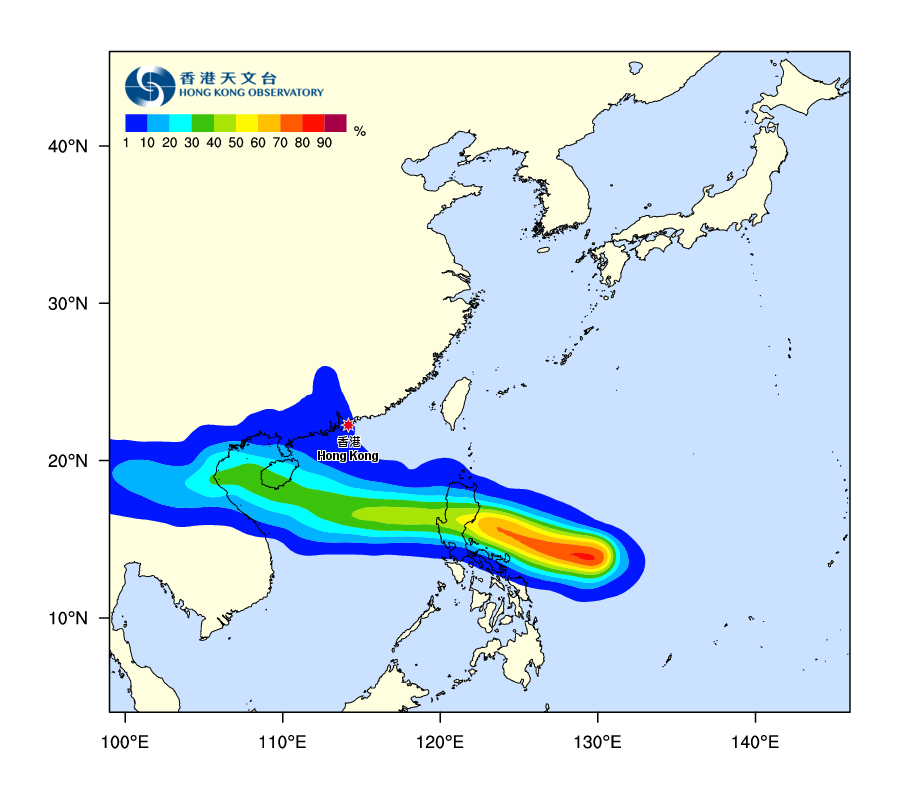
Figure 2 The track probability forecast for the case of TC Podul in late August 2019.
In general, the pressure will drop significantly as a TC approaches. When intense cold surge affects Hong Kong, the pressure will rise markedly with temperatures dropping drastically. If members of the public can keep track of the evolution trends of the elements associated with the extreme weather using probability forecasts, they could make necessary preparation at the earliest instance possible to reduce potential impact or loss that may be incurred.