Temperature Trend at Fingertips
Temperature Trend at Fingertips
WONG Wai-kin
August 2017
Weather is a part of our everyday lives. People pay attention to weather changes to get better prepared. At present, the Observatory provides 9-Day Weather Forecast, including daily information on wind direction, wind speed, temperature, humidity and sky condition for the next 9 days. This is what we call "deterministic" weather prediction in which specific values or description of weather elements are given in the forecast for each day. The reader may have heard of the "Butterfly effect". It refers to a butterfly in Brazil flapping its wings causing tornadoes in Texas. Weather system is in fact a typical system in which "Butterfly effect" may occur. Weather prediction inevitably comes with uncertainty. As such, the certainty of the "deterministic" forecast generally decreases with increasing forecast time, making long period forecast usually less accurate. To deal with this problem, forecasters and meteorologists commonly utilize "ensemble forecasting" technique to assess the likely weather condition and other alternative scenarios[1].
In "ensemble forecast", the computer weather model is executed simultaneously with a set of different initial conditions, or with slight modifications in atmospheric physical processes to forecast possible weather changes in the future and to generate "probabilistic forecast" of various weather scenarios. The key difference between probabilistic forecast and deterministic forecast is that deterministic forecast indicates a day with or without rain while probabilistic forecast gives the chance of rain occurrence, for example, 70% chance of rain reflecting higher likelihood of rain to occur. Figure 1 depicts forecast rainfall patterns from around 50 ensemble members. There were more than 70% of members showing occurrence of rain in Hong Kong. A particular member with less rainfall (Map ("A" as pointed by the arrow on the right side of Fig.1) forecasts local temperatures above 30 degrees in general, while a "rainy" member ((Map "B" in Fig.1) shows temperatures in parts of the territory ranging between 26 and 28 degrees. Based on the temperature forecast by different members of "ensemble forecast", we can likewise give the probabilistic forecast of temperatures[1].
The Observatory provides "extended outlook" forecast service utilising ensemble forecast data. These data are automatically post-processed to generate probabilistic weather prediction which serves as the scientific basis for extending weather forecasts up to two weeks ahead. It enables the public to get hold of the trend of future weather. The 14-day probability forecast of daily minimum and maximum temperatures was launched in June 2017 (see samples in Fig. 2 and 3). The time series chart of probabilistic forecast of daily minimum (maximum) temperature shows the chance of minimum (maximum) temperature occurring within 1 degree of the marked temperature shown on the vertical axis of the graph in the next 14 days. Different colors represent different probabilities. For instance, if the probability of maximum temperature attaining 32 degrees on a certain day is 60%, it means there is about a proportion of 6 out of 10 cases with maximum temperatures ranging between 31 and 33 degrees. The "extended outlook" forecast product also provides a climatological average of minimum or maximum temperatures, as shown by the gray solid line in Fig.2, for reference. The upper and lower gray dotted lines on the chart represent the 85th and 15th percentiles of the climate respectively, meaning that there are 70% of the same period in the past with minimum or maximum temperatures falling within the range bounded by the upper and lower dotted lines.
What are the benefits of using probabilistic forecasts? Taking temperature forecast probability as an example, a warmer colour (yellow to red) indicates a higher chance of occurrence. The trend of the higher probability region represents a higher chance of temperature scenarios. Figure 2 shows a case of the passage of a cold surge in Hong Kong. The daily minimum temperatures on the days before 22 February 2017 were more likely in between 15 and 17 degrees; while on 25 - 26 February the daily minimum temperature had a higher chance of falling to 12 to 14 degrees. In fact, the minimum temperatures recorded at the Observatory shown by the connected black dots in Fig.2 indicated a temperature fall after 22 February, which was in consistent with the "extended outlook". Another case in Fig. 3 shows the maximum temperature probability forecast in summer, where the variations in probabilistic forecast generally aligned well with the actual ups and downs in daily maximum temperatures recorded at the Observatory.
Probabilistic forecast has another key application, that is users can make reference to the predicted probability for risk assessment in their planning of daily living and arrangement of holiday activities according to their acceptable risk levels under different weather conditions. By making an appropriate assessment, they can determine whether to continue with their activity or to take contingency measures in a timely manner. Here, we take an example of the probability forecast of minimum temperature to illustrate this concept. During the passage of a cold surge in winter, the public can make reference to the forecast probability of the daily minimum temperature falling below the cold level. As shown in Fig.2, the probability of minimum temperature reaching 12 degrees was around 30% on 24 February. For the elderlies and people with chronic medical conditions, a 30% chance of weather becoming cold may already need to call for attention. They can then prepare winter clothes earlier to reduce the risk of possible health impact arising from sudden temperature changes.
The Observatory is exploring the development of other probabilistic forecast products including probability forecasts of tropical cyclone track, wind speed and rainfall intensity. We hope the probability forecast service can help users better understand the uncertainties in the changes of weather. If members of the public, public utilities and decision-makers could gradually utilise risk management concepts in their mode of decision-making, it is believed that the society and the vulnerable groups are able to better respond to and mitigate the effects of high-impact weather.
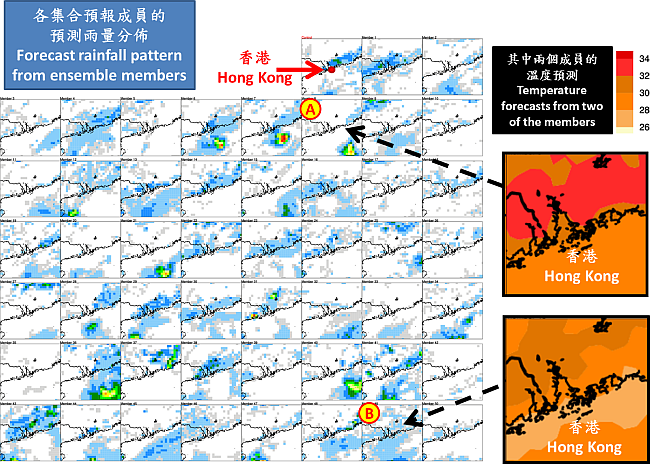
Figure 1 Ensemble member forecasts of rainfall and temperature.
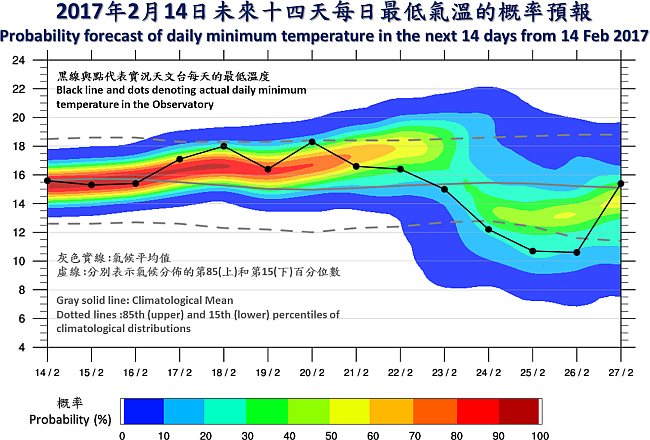
Figure 2 Sample of probability forecast of daily minimum temperature for the next 14 days.
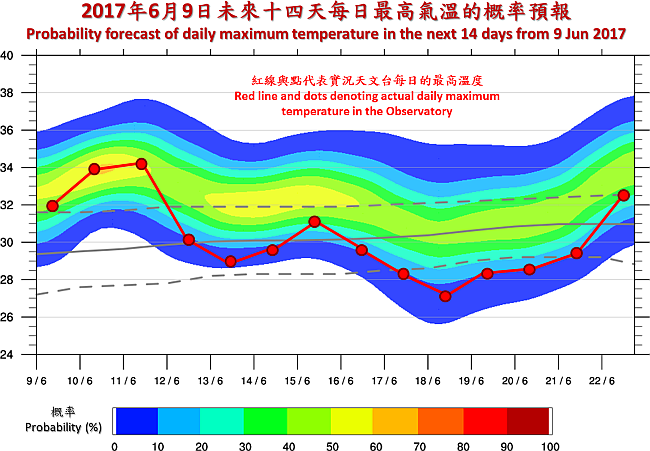
Figure 3 Sample of probability forecast of daily maximum temperature for the next 14 days.
References:
[1] "Let's talk about Weather Forecasting"
[2] Webpage of the "Extended Outlook" forecast service
[3] Mobile version
[1] "Let's talk about Weather Forecasting"
[2] Webpage of the "Extended Outlook" forecast service
[3] Mobile version