How to Assess the Intensity of Tropical Cyclones?
How to Assess the Intensity of Tropical Cyclones?
SHUM Chi-tai
September 2011
In the weather bulletins issued by the Hong Kong Observatory, intensity changes of tropical cyclones are sometimes mentioned (for example: Tropical Storm Nock-ten has intensified into a severe tropical storm). However, how do forecasters estimate the intensity of tropical cyclones in real operations?
Use of surface observation data
To assess the intensity of a tropical cyclone accurately, the best way is to collect and analyze the wind speed information near the center of the storm. However, since tropical cyclones develop over the ocean, observations from meteorological stations and ships are sparse. It is not easy for forecasters to obtain reliable surface wind observations. Generally speaking, when a tropical cyclone edges closer to an island or the coastline, surface observations can play a more important role. Tropical cyclone Pabuk is one of the examples. Pabuk was located over the western part of Hong Kong on 10 August 2007. The observations of the Observatory’s meteorological stations in Cheung Chau and Waglan indicated that the Hong Kong waters were generally affected by sustained gale force winds. This revealed that Pabuk had reached tropical storm intensity (Figure 1).
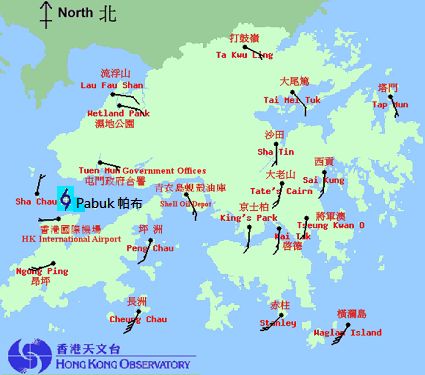
Figure 1: Wind distribution at 2 p.m. on 10 August 2007, when Tropical Storm Pabuk was centered over the western part of Hong Kong.
Use of satellite observation data
Owing to the limitation of surface observations, an important tool for the forecasters to assess the intensity of tropical cyclones is to make use of satellite information, which has the advantage of excellent availability and extensive coverage. One of the methods still commonly used by meteorological services in the world nowadays is the technique developed by D'vorak. In simple words, D'vorak technique analyzes the distribution and patterns of cloud top temperatures of a tropical cyclone. Incorporating with the statistical data summarized by D'vorak through a number of years, the intensity of a tropical cyclone can be deduced indirectly. One example is illustrated in Figures 2 and 3. On 15 September 2010, tropical cyclone Fanapi was still loosely organized. On 18 September 2010, its center was noticeably surrounded by tight spiral cloud bands, forming a discernible eye. D'vorak technique can quantitatively estimate the intensification of Fanapi from tropical depression to severe typhoon strength through analyzing the evolution of its cloud patterns.
The advantage of this technique is that there are no geographical limitations on the location of the tropical cyclone. Forecasters can adopt this technique to assess the intensity of tropical cyclones as far as a few thousand kilometers away. Its disadvantage lies on the subjectivity arising from the judgment of cloud patterns by forecasters. As D'vorak technique is based on statistical analysis of past tropical cyclones, larger errors are expected for some extreme cases (for example: cyclones with exceptionally rapid rate of intensification).
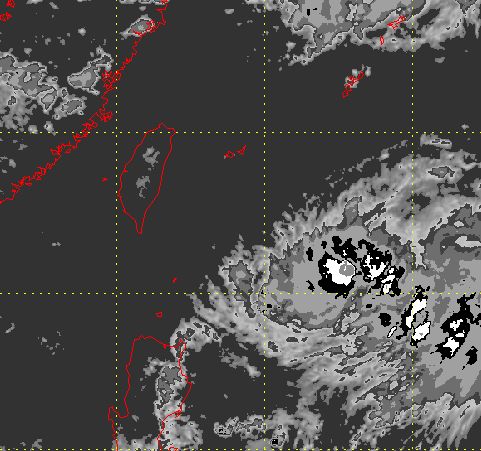
Figure 2: Enhanced IR satellite picture of Tropical Depression Fanapi at 13:32H on 15 September 2010.(Extracted from MTSAT satellite image of Japan Meteorological Agency)
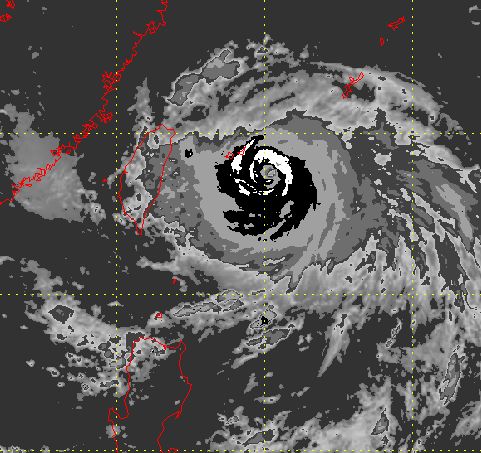
Figure 3: Enhanced IR satellite picture of Severe Typhoon Fanapi at 13:32H. on 18 September 2010.(Extracted from MTSAT satellite image of Japan Meteorological Agency)
Use of radar observation data
When a tropical cyclone enters the surveillance range of Doppler radar of the Hong Kong Observatory, forecasters can assess the intensity of the storm by making reference to the maximum wind speed derived from movement of rain echoes. From Figure 4, winds reaching hurricane force (wind speed of 33 m/s or above) can be detected by the radar near the eye of tropical cyclone Molave at 21H. on 18 July 2009. However, based on such wind data, one cannot determine whether Molave had reached typhoon strength immediately. The main reason is that wind speed measured by the Doppler radar is that at a distance above the ground, and such data should be appropriately transformed to reflect the true surface wind speed. Studies indicated that there is a proportionate relationship between the maximum wind speed detected by the Doppler radar and the intensity of the tropical cyclone. Such result is useful in applying the radar observation data to analyze the intensity of tropical cyclones.
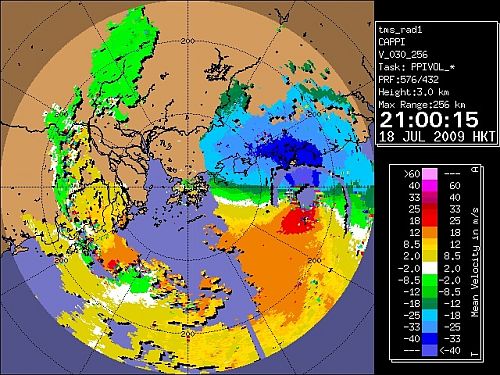
Figure 4: Radar imagery showing the Doppler velocity of tropical cyclone Molave at 21H. on 18 July 2009.
Aircraft monitoring
The United States arranged aircraft regularly to monitor the structure of tropical cyclones in the northwestern Pacific on or before 1987. After the project has ceased for more than 10 years, another project known as "Dropsonde Observation for Typhoon Surveillance near the TAiwan Region" (DOTSTAR) has been launched by Taiwan since 2003. Its aim is to observe the structure of selected tropical cyclones in the northwestern Pacific using aircrafts. Although the application of such data in determining the intensity of cyclones is still under study, the additional information is, to some extent, useful reference for the forecasters.
Conclusion
The methods mentioned above all have their respective pros and cons in assessing the intensity of tropical cyclones. Forecasters need to analyze the reliability of various kinds of data carefully and then make a timely and professional judgment.
References:
[1] 陳浩新、林鄺泗蓮︰利用多普勒天氣雷達數據評估熱帶氣旋強度的探討,香港天文台,2009。
[2] "Introduction to Dropsonde Observation for Typhoon Surveillance near the TAiwan Region" (DOTSTAR)
[1] 陳浩新、林鄺泗蓮︰利用多普勒天氣雷達數據評估熱帶氣旋強度的探討,香港天文台,2009。
[2] "Introduction to Dropsonde Observation for Typhoon Surveillance near the TAiwan Region" (DOTSTAR)