Tropical Cyclone Forecast Track Information
During typhoon season, information on tropical cyclone forecast track is one of the items that the public and the media are most concerned with. This information is provided through various ways to meet different needs of the public and the media. This article introduces the various channels to obtain such tropical cyclone track information.
Tropical Cyclone Track Information webpage
There are two versions of the webpage, namely the "Fixed-area map version" (Figure 1) and the "Geographical Information System (GIS) version" (Figure 2). Apart from desktop browsers, the two versions are also accessible on the "MyObservatory" mobile app. The "fixed-area version" shows the forecast track of a tropical cyclone with its intensity indicated by different coloured symbols, facilitating viewing and sharing of the latest storm information. If one needs to view detailed geographical information, for example the cities or areas likely to be affected by the tropical cyclone, one may use the interactive map on the "GIS version" to pan and zoom into the area of interest. Furthermore, on desktop browsers, one can also overlay the latest satellite or radar imagery to know about the extent of clouds and rain bands associated with the tropical cyclone at the time.
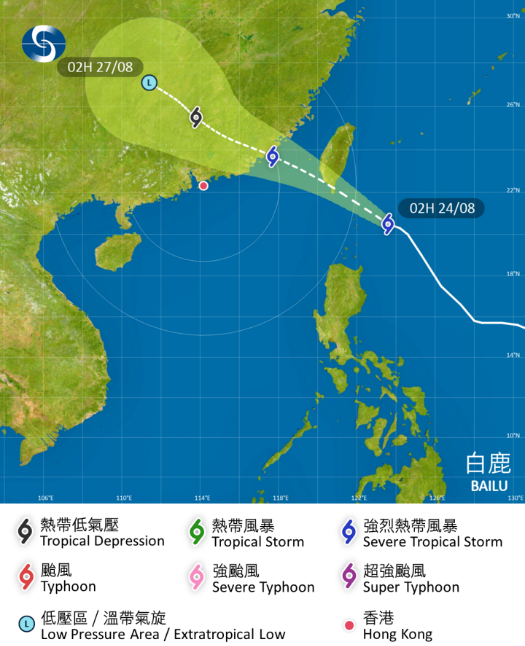
Figure 1: "Fixed-area map version" of tropical cyclone forecast track map enabling viewing of important information at a glance.
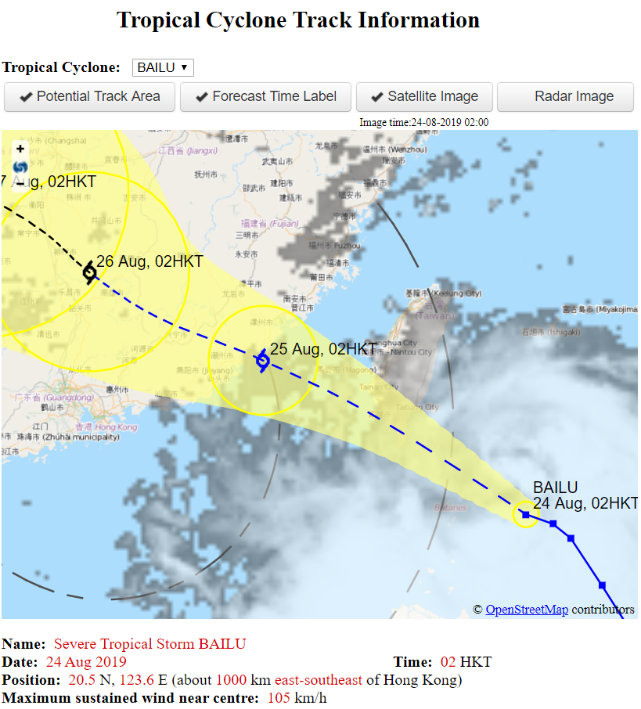
Figure 2: Detailed geographical information available on the interactive map of the "GIS version" of tropical cyclone forecast track map, allowing overlay of the latest satellite and radar imagery.
"Earth Weather"
"Earth Weather" was recently launched on the Observatory's website and "MyObservatory" App. In addition to the latest tropical cyclone forecast track issued by the Observatory, computer model forecasts of surface wind direction shown in the form of animated streamlines and overlaid with a coloured map of wind speed or rainfall forecast facilitates people getting hold of the extent of winds and rain associated with the tropical cyclone at different forecast times (Figure 3). It should be noted that there is no manual adjustment to computer model forecast display. It explains why sometimes it may not be entirely consistent with the Observatory's tropical cyclone forecast track.
Figure 3: The "Earth Weather" website using animated streamlines to represent wind direction and colours to depict wind speed, and enabling users to overlay the Observatory's tropical cyclone forecast track.
Tropical cyclone track data set
Apart from directly accessing images of tropical cyclone forecast tracks, you may be interested in downloading the corresponding data. The Observatory has recently made available the machine-readable tropical cyclone track data files in XML format on its website and the DATA.GOV.HK portal. The content of the data files includes past and forecast tropical cyclone positions, intensity categories and the maximum sustained wind speed near the centre of the tropical cyclone (Figure 4). Please refer to the data dictionary on the DATA.GOV.HK portal for details of the data files.
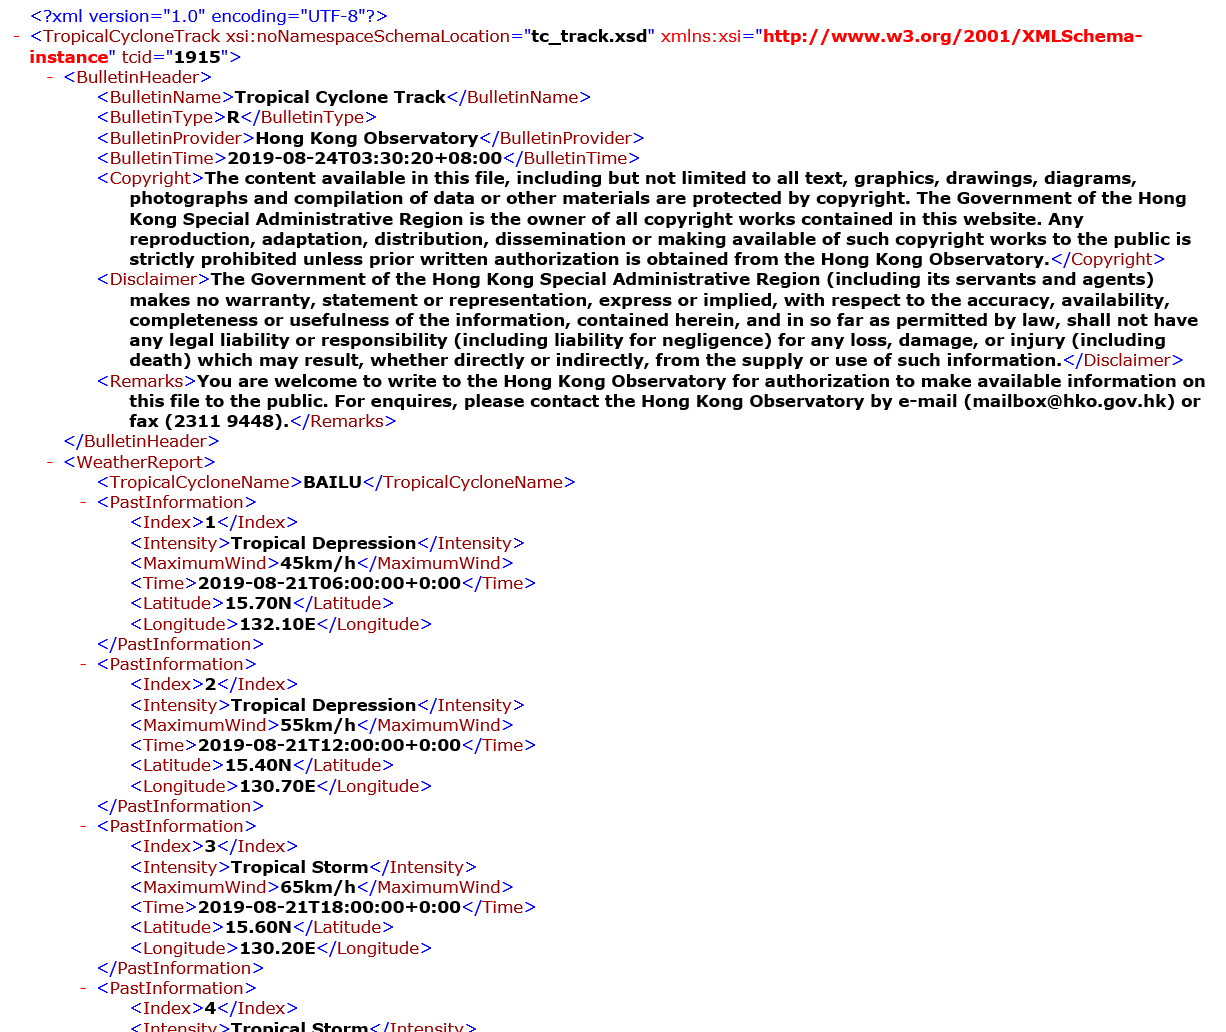
Figure 4: Sample of an extract of a tropical cyclone forecast track data file in XML format
No matter how you obtain tropical cyclone forecast track information, please be reminded that very often there will be errors[Note] in the forecast track and intensity, and such errors generally increase with forecast lead time. You can also browse the Tropical Cyclone Track Probability webpage to appreciate the trend of its movement and the chance of different track scenarios. Please also take note of the latest tropical cyclone warning issued by the Observatory.
Note:
Extended Reading: Super Computer Super Accurate?