Satellite imagery of Super Typhoon Nida
Satellite Imagery of Super Typhoon Nida
CHAN Chik-cheung
March 2010
The Hong Kong Observatory uses a new tropical cyclone classification scheme with effect from 2009 (see previous article on this). It consists of 6 categories as follows:
| Tropical Cyclone Classification | Maximum sustained winds near the centre (km/h) |
|---|---|
| Tropical Depression (TD) | <63 |
| Tropical Storm (TS) | 63-87 |
| Severe Tropical Storm (STS) | 88-117 |
| Typhoon (T) | 118-149 |
| Severe Typhoon (ST) | 150-184 |
| Super Typhoon (SuperT) | 185 or above |
In November 2009, Nida over the western North Pacific developed into a Super Typhoon. It had gone through all the 6 intensity classifications during its life cycle. Satellite pictures capturing images of Nida during each of the intensity classifications are shown below. This series of satellite pictures constitutes a good reference for readers interested in tropical cyclone. From the series of satellite pictures, the increasingly organized banding feature of Nidas cloud as a swirl became progressively more prominent as it intensified from a tropical depression into a severe tropical storm (Figure 1-3). An eye developed as Nida intensified into a typhoon (Figure 4) and the eye became smaller and yet more well-defined as Nida developed further into a super typhoon (Figure 5-6).
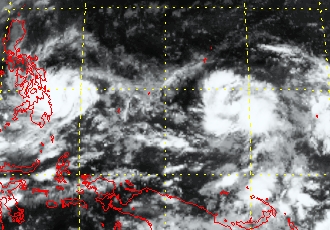
Figure 1. Tropical Depression Nida as shown on IR Satellite Picture at 00 UTC on 23 November 2009. (Japan Meteorological Agency MTSAT-1R infra-red satellite image)
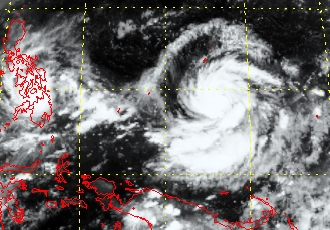
Figure 2. Tropical Storm Nida as shown on IR satellite picture at 18 UTC on 23 November 2009. (Japan Meteorological Agency MTSAT-1R infra-red satellite image)
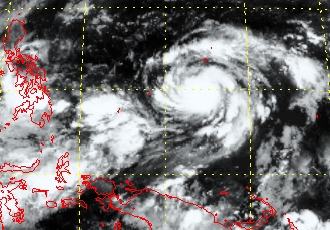
Figure 3. Severe Tropical Storm Nida as shown on IR satellite picture at 18 UTC on 24 November 2009. (Japan Meteorological Agency MTSAT-1R infra-red satellite image)
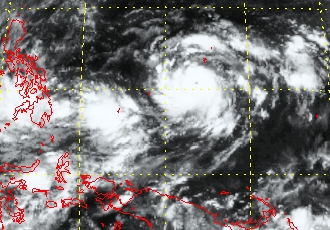
Figure 4. IR satellite picture at 00 UTC on 25 November showing Nida intensified into a typhoon. (Japan Meteorological Agency MTSAT-1R infra-red satellite image)
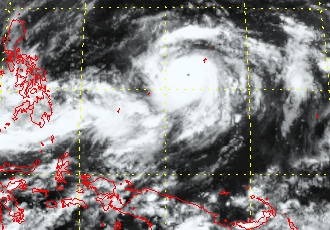
Figure 5. Nida continued to strengthen further on 25 November to a severe typhoon. (Japan Meteorological Agency MTSAT-1R infra-red satellite image)
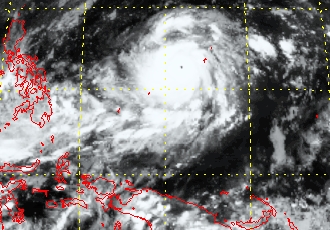
Figure 6. IR satellite picture at 12 UTC on 25 November 2009 showing Nida became a super typhoon. (Japan Meteorological Agency MTSAT-1R infra-red satellite image)