The possible effects on earth's climate by the solar spectral change in a solar cycle
The possible effects on earth's climate by the solar spectral change in a solar cycle
CHIU Hung-yu
December 2010
The discrepancy between intuition and research findings
Intuitively, most people tend to believe that the Earth would be warmed by more light and heat radiated from the sun during its active stage at the period of solar maximum, and that decreasing solar activities would reduce the total solar energy output and cool down the Earth. However, atmospheric physicists, Joanna Haigh and her colleagues at the Imperial College London recently found that solar radiation affects Earth's surface climate in the opposite way, at least during the few years (2004-2007 during sunspot cycle 23) of solar activity recession before the solar minimum in 2008 (Figure 1). Their findings are published in Nature, October 2010.
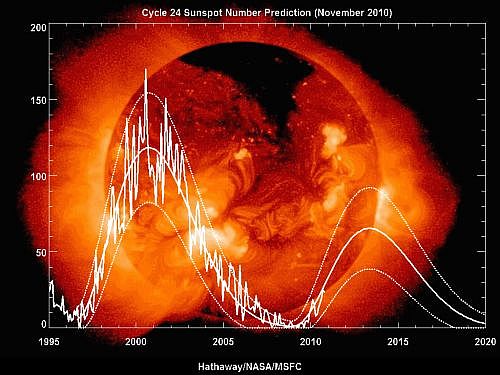
Fig.1 The sunspot number of solar cycle 24 predicted in November 2010 (Image source: Courtesy of NASA)
Solar spectral changes
They found that the amount of ultraviolet radiation was much smaller than expected and the amount of visible light reaching the Earth increased during the period. The visible light for warming the Earth's surface increased even during the declining phase of solar activity.
The spectral changes seemed to have altered the distribution of ozone in the atmosphere. They showed that the stratospheric ozone concentration decreased below an altitude of 45 kilometres above sea level during the period 2004-2007, but the ozone concentration increased above this altitude.
Haigh has also explained how the above response of ozone to changes in solar ultraviolet (UV) radiation modulates the "radiative forcing" of sunlight. An increase in ozone will reduce the flux of solar ultraviolet radiation reaching the tropopause and increase the flux of infrared radiation in stratosphere. The net effect would be a small increase in the net downward flux of solar radiation.
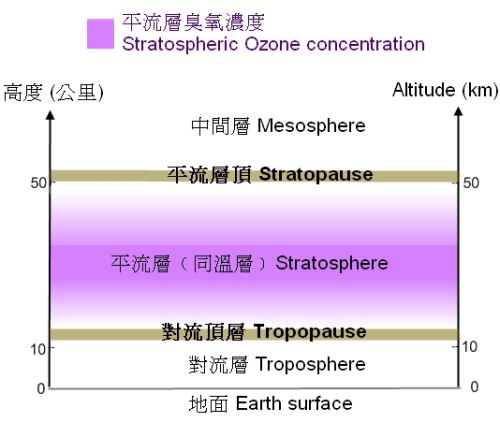
Fig.2 Ozone is usually most abundant near the mid (or lower) stratosphere.
What is "radiative forcing"?
"Radiative forcing" is the change in the net vertical (downward minus upward energy flow) flux of solar radiation at the tropopause due to a change in the strength of an external driver for climate change, such as a change in the concentration of carbon dioxide or the radiation output of the Sun. A positive value of "radiative forcing" (more incoming energy) denotes warming on the earth surface and in lower atmosphere and vice versa.
In the "Intergovernmental Panel on Climate Change" (IPCC)'s report, "radiative forcing" is further defined as the change relative to the year 1750 (the pre-industrial era). It often refers to a global and annual average value.
Besides "radiative forcing", what is the possible climatic effect associated with the "ozone response"?
Ozone helps to heat up the stratosphere both by absorbing the sun's ultraviolet radiation and by absorbing infrared radiation from the lower atmosphere (troposphere) as a greenhouse gas. The less the ozone, the cooler the stratosphere (Figure 2) becomes. These changes in the stratosphere may have indirect downward impact on the tropospheric circulations, resulting in climate change.
Possible effects of producing weather anomalies on the Earth's climate?
Haigh's findings have drawn other scientists' attention and aroused discussions. If the warming and cooling effects on earth could be out of phase with the solar activity and the ozone-related "radiative forcing", in what ways would the processes in the troposphere and stratosphere modulate the Earth's climate? In response to Haigh's findings, another scientist, Quirin Schiermeier, has reiterated some meteorologists' belief that "blocking events" may occur more frequently during phases of low solar activity.
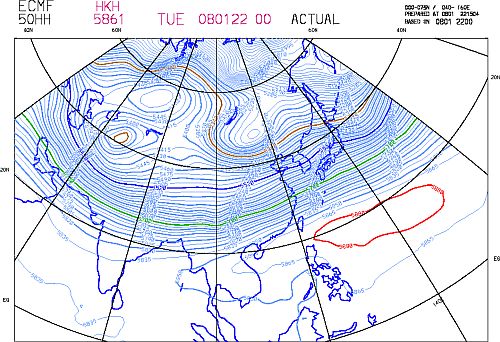
Fig.3 A blocking weather system consisted of a blocking High and a cut-off Low appeared west of the north Asia on the 500 hPa upper-air weather chart on 22 January 2008. Meanwhile, a deep westerly trough with an embedded Low appeared in the east of north Asia.
What is a "blocking event"?
Figure 3 shows a typical "blocking event", during which there is a "blocking system" consisting of a blocking high (on the pole-ward side) and a cut-off low. The pattern of the associated height field nearby the blocking high resembles the shape of a Greek letter [ (Omega). A cut-off low is a closed cold core low completely detached from the upper-air westerly air-stream.
A blocking system is a slow moving or nearly stationary large weather system. The upper-air westerly air-stream (in east) ahead of it forms a significant wavy flow or deep trough as being distorted by the blocking system. The dry, rainy, snowy or cold weather in different regions affected by such kind of large quasi-stationary weather system and the associated deep trough could persist for many days. Furthermore, the collapse of a blocking system could also release a large pool of extreme cold air southward. If "blocking event" and collapse of "blocking system" occur frequently, the possibility of regional extreme weather like snow damage and very cold weather will increase.
So, "Blocking events" are unusual patterns of upper-air (e.g. on 500 hPa level) westerly jet stream in the upper troposphere that can cause intervals of cold spell and abnormal weather. Since solar activity is cyclic in about every 11 years, it should have no long-term impact on climate. Haigh's findings may provide some clues on understanding and quantifying natural climatic fluctuations.
Exceptional cold weather events occur albeit average global temperatures is rising
In addition to the more than expected decline of solar ultraviolet flux, ozone reduction at an altitude of the stratosphere below about 45 km above sea level might cool down part of the stratosphere above the tropopause (Figure 2). Would it imply subsequent interactions between the stratosphere and the troposphere to cause abnormal upper-air jet streams, leading to "blocking situations" pushing the polar cold air to persistently move southward (Figure 3), resulting in regional extreme weather on earth surface?
The solar activity was low during the minimum sunspot period in recent years. Exceptional cold weather had occurred in winter of some regions albeit average global temperatures is rising. For example in early 2008, south China suffered from a severe snowstorm while Hong Kong experienced the longest cold spell since 1968 (Figure 4). Since 2008 is a year of solar minimum, could it have any relationship with the exceptional cold weather event? Or, could the La Nina event that occurred between late 2007 and mid 2008 be an alternative cause for the cold weather event? ... To better understand and answer these questions, scientists need more data for further studies.
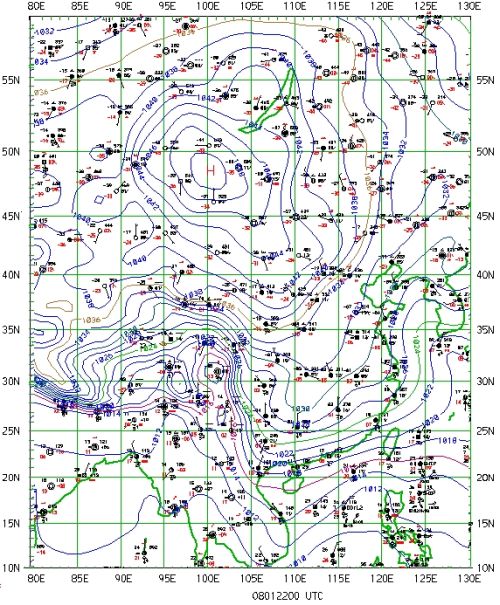
Fig.4 A persistent strong and large High pressure system affected most regions in East Asia, during the long cold spell in early 2008. Its centre once appeared near Mongolia on 22 January 2008.
References:
[1] "An influence of solar spectral variations on radiative forcing of climate", by Haigh, J. D., Winning, A. R., Toumi, R. & Harder, J. W., Nature, Vol.467, No.7316, pp.696-699, 7 October 2010.
[2] "Declining solar activity linked to recent warming", by Quirin Schiermeier, published online on 6 October 2010, Nature.
[3] "The 2008 South China snow storm and the cold weather of Hong Kong - a retrospect".
[4] "The Longest Cold Spell since 1968", Press Release (13 February 2008), Hong Kong Observatory.
[5] "The analysis and forecasting techniques for the prolonged cold weather of south China coastal areas in early 2008", by TONG Yu-fai, LI Yuet-sim and CHAN Sai-tick, Hong Kong Observatory. (in Chinese only)
[6] "Glossary", Intergovernmental Panel on Climate Change (IPCC).
[7] "Climate Change 2007: Working Group I: The Physical Science Basis", Intergovernmental Panel on Climate Change (IPCC).
[8] "El Nino and La Nina", Hong Kong Observatory.
[9] "List of El Nino & La Nina years", NOAA La Nina Page, National Oceanic and Atmospheric Administration.
[10] "Solar Cycle Prediction (Updated 2010/11/03)", Space Weather Prediction Center, NASA.
[11] "Layers of the Atmosphere - Standardized Temperature Profile", National Weather Service, NOAA.
[12] "Earth's ozone layer appears to be on the road to recovery", NASA Science, NASA.
[13] "The NOAA Annual Greenhouse Gas Index (AGGI)", NOAA Earth System Research Laboratory.