Poisson Distribution and Radiological Measurement
Poisson Distribution and Radiological Measurement
KONG Yu-chau
July 2022
Poisson Distribution of Radioactive Decay
Radioactive decay is a random process. The number of decays per second is called activity and is usually measured in Becquerel (Bq). Nonetheless, it is only an average quantity. The actual number of decays over a period of time is generally described by the Poisson distribution. For example, radiocaesium-137 with an activity of 1 Bq will undergo on average 10 decays in 10 seconds. However, the numbers of decays on different occasions occur with different probabilities (Figure 1). The numbers closer to the average value have higher chance of occurrence. On the other hand, the chance of occurrence decreases gradually for those numbers farther from the average value.
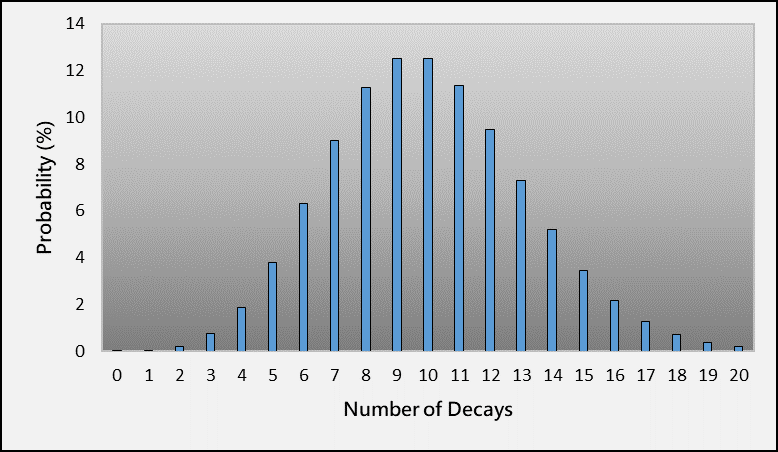
Figure 1 The probability distribution of the number of decays in 10 seconds for 1 Bq of caesium-137.
The characteristic of Poisson distribution introduces different degrees of uncertainty to radiological measurements. According to the distribution of Figure 1, 10 decays may be recorded in a measurement, but it is also likely to be other numbers. In such case, no matter how high the capability of the detector is, the measurement results are still subject to uncertainties.
How to reduce measurement uncertainties?
In statistics, standard deviation is usually used to describe the degree of dispersion of a distribution and quantify the uncertainty of a measurement. According to the formula of standard deviation, the uncertainty arising from the Poisson distribution is related to 1/√N, where N is the number of detected signals of a detector. Therefore, the uncertainty will decrease with increasing number of signals detected by the detector. One of the effective ways to increase the value of N is to extend the measurement time. Figure 2 illustrates the effect of different measurement times on the distributions of measurement results. The measurement results obtained from a longer measurement time form a narrower distribution with smaller uncertainty. In contrast, those from a shorter measurement time display a wider distribution and the uncertainty is larger.
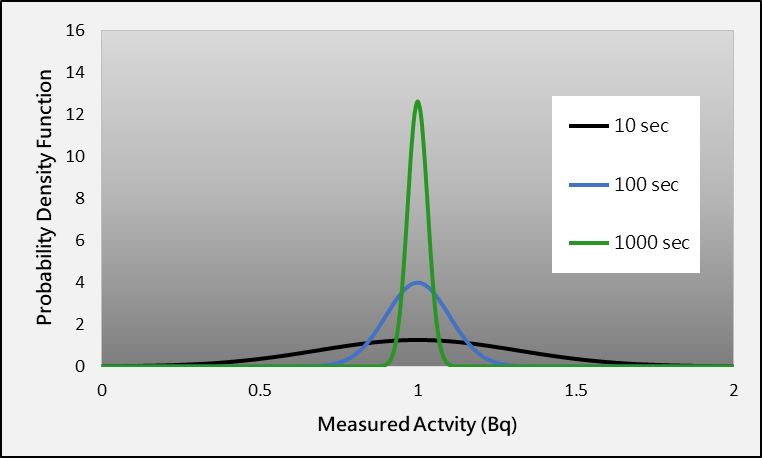
Figure 2 Effect of different measurement times on the distributions of measurement results. (Note: A larger value of the probability density function represents a higher chance of occurrence of the measured activity in the corresponding region.)
Measurement Time and Detection Limit
Since the activity levels of the radionuclides monitored in the Hong Kong Observatory‘s Environmental Radiation Monitoring Programme are rather low, the samples must be measured for a long time in the laboratory to increase the number of signals detected by the detector in order to reduce the measurement uncertainty. In reality, it will be impossible to extend the measurement time indefinitely to reduce the measurement uncertainty to zero. When the activity of a radionuclide is lower than a certain level, the measurement uncertainty cannot be effectively reduced even under prolonged measurement time, causing the detected signals to be indistinguishable from the signals attributed to electronic noise and background radiation. This level is called the detection limit of the detector.