Skip Content
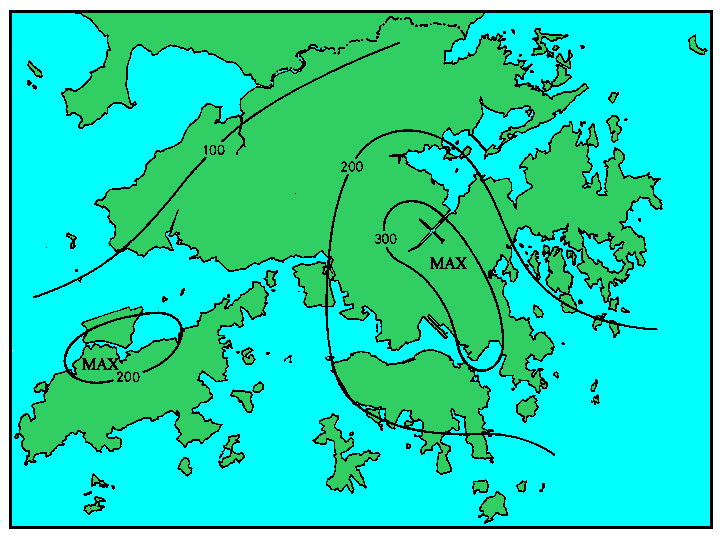
Figure 3e.
Fig. 3e 24-hour rainfall distribution map for 12 August 1995
Contour values are in millimetres