Monitoring on Volcano and Wildfire Activity using Satellite
Monitoring on Volcano and Wildfire Activity using Satellite
TANG Wai-ho, YEUNG Hon-yin and NG Pan
February 2026
People's impressions of meteorological satellite imagery most likely stem from the cloud imageries of tropical cyclones. Visible imagery can display fine cloud textures during the daytime, while infrared imagery can provide cloud images around the clock. The acquisition of these imageries relies on the visible and infrared imager equipped on meteorological satellites, which functions like a camera capable of capturing images in specific wavelength bands.
Traditional "visible light" imagery is actually monochrome based only on red light at wavelength of around 0.65 microns. Modern imagers can also capture blue light at about 0.47 microns and green light at about 0.50 microns, allowing true colour imagery to be synthesized through post-processing to simulate the colours perceived by the human eye. With true colour imagery, white clouds can be better distinguished from dust/ash plumes generated by wildfires or volcanic activity. Traditional infrared imagery is also monochrome imagery captured at the wavelength of approximately 10.8 microns. It can determine the temperature and assess the height of objects by measuring their emitted electromagnetic waves. However, one drawback is that clouds and dust/ash plumes cannot be effectively distinguished on an infrared image.
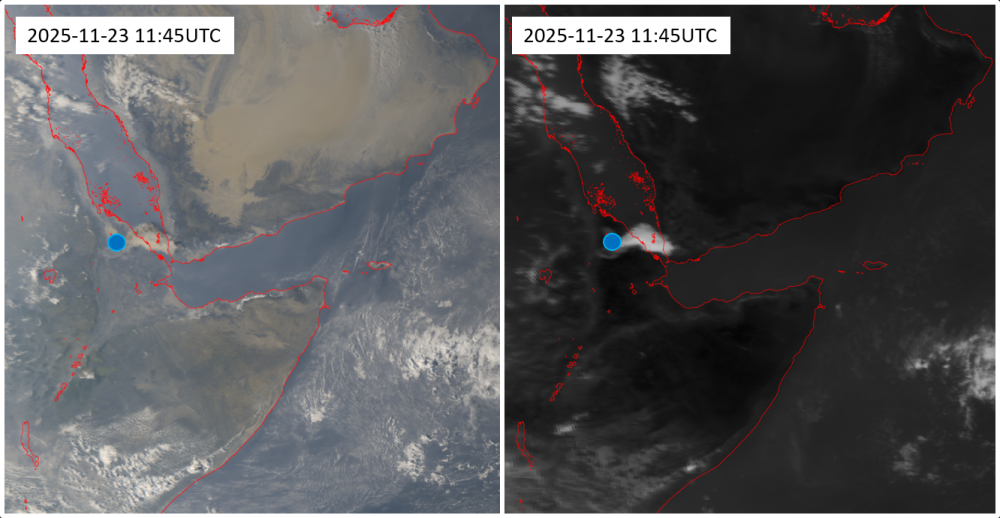
Figure 1 The Hayli Gubbi volcano (blue dot), located in Ethiopia, Africa, erupted on 23 November 2025. Shown above are the images captured by China's Fengyun-4B satellite at 11:45 UTC on that day: (left) true colour image and (right) infrared image. The released volcanic ash plume appears in bright brownish-gray colour in the true colour image, distinct from the clouds in bright white over the sea. In contrast, the infrared image shows no significant difference between the two objects.
Latest imagers can also observe other specific wavelength bands, aiding in the monitoring of various weather phenomena such as sand/dust storms and trace gases in the atmosphere. To facilitate monitoring by forecasters, a composite satellite image called "RGB" image can be produced by combining images from specific bands according to weights or mathematical formula (where R, G, and B refer respectively to the red, green, and blue pixels as seen on a display screen). True colour imagery is the simplest example of RGB imagery. On a screen, the R, G, and B pixels directly display the intensities of red, green, and blue light detected by the satellite. Take sulfur dioxide (SO2) gas released from volcanic eruptions as another example. Its chemical molecules strongly absorb infrared radiation near the 7.4-micron and 8.6-micron bands. An RGB image created by substituting these two bands for red and green light can more clearly manifest the distribution of SO2. The Hayli Gubbi volcano, located in Ethiopia, Africa, erupted on 23 November 2025. The released volcanic ash and gases, which drifted eastward with upper-air westerly winds affecting the skies above northern India, central China, and southern Japan in the following couple of days, were clearly visible in the SO2 RGB imagery (Figure 2).
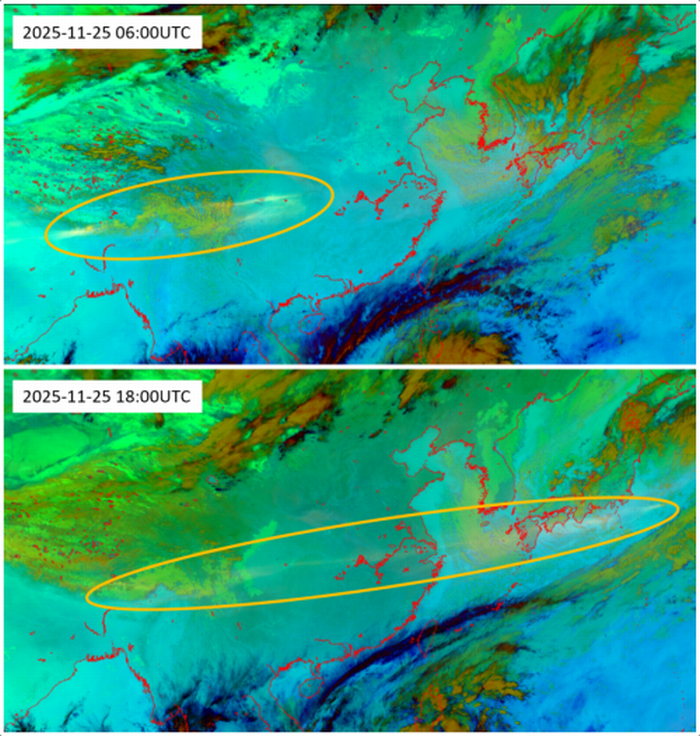
Figure 2 SO2 RGB images based on Japan's Himawari-8 satellite at 06:00 UTC (top) and 18:00 UTC (bottom), 25 November 2025. Drifting eastward with upper-air westerly airstream across the skies above northern India, central China, and southern Japan, the volcanic ash and gases released from the Hayli Gubbi volcano appear in these RGB images as a narrow and generally east-west oriented band of pale yellow colours (marked by the orange-yellow ellipses).
Similar RGB imagery method can also be applied to monitor ground heat sources such as wildfires. According to the principle of physics, the higher the temperature of an object, the shorter the wavelength of the peak electromagnetic radiation it emits. Taking the fire temperature RGB imagery as an example, its R, G, and B pixels represent the intensities detected by satellite in the 3.8-micron, 2.3-micron and 1.6-micron infrared bands respectively. Milder heat sources appear as red dots on the image. When the heat source intensifies further and releases more short-wavelength infrared radiation, the dots will evolve into yellow or even white dots on the image.
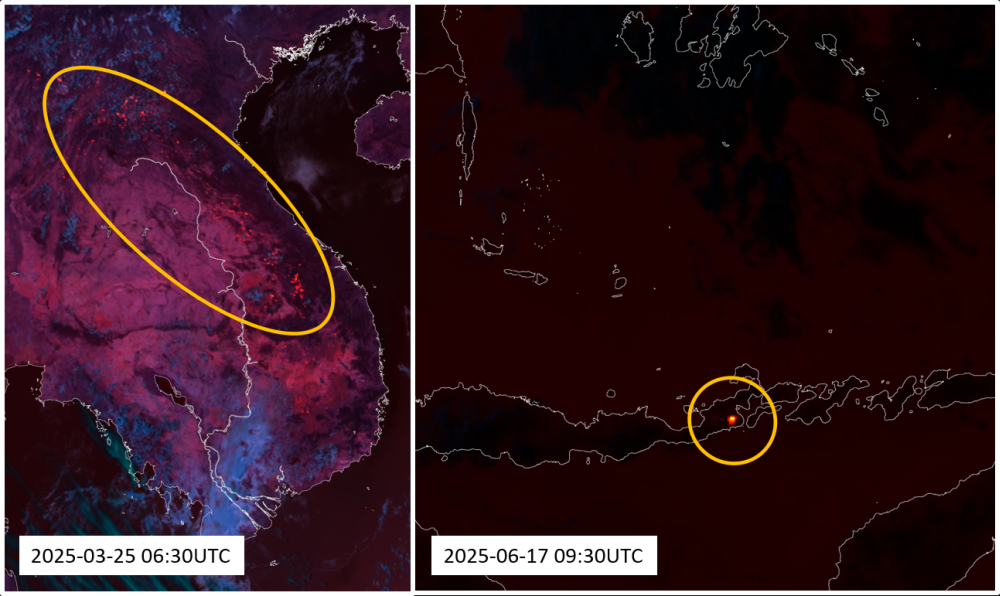
Figure 3 (Left) Fire temperature RGB image based on Japan's Himawari-9 satellite at 06:30 UTC, 25 March 2025. Numerous red dots indicate burning activities across the Indo-China Peninsula; (Right) Fire temperature RGB image based on Japan's Himawari-9 satellite at 09:30 UTC, 17 June 2025. The bright red dot marks the moment of the eruption at Lewotobi volcano of Indonesia.
Besides the above mosaic methods based on the visible and infrared imagers, other meteorological satellite instruments also aid in monitoring volcanic activity, such as the Tropospheric Monitoring Instrument (TROPOMI) on the Europe's Sentinel-5P satellite and the Geostationary Environmental Monitoring Spectrometer (GEMS) on the Republic of Korea’s GK2B satellite, etc., which may be introduced when opportunity arises in the future!