World in Millisecond of Two-Dimensional Video Disdrometer
World in Millisecond of Two-Dimensional Video Disdrometer
TANG Wai-ho
March 2024
Everyone has probably experienced getting caught in the rain without an umbrella and may have noticed the differences between summer and winter rainfall. In general, rainfall in summer comes from cumulonimbus clouds as a result of atmospheric convection so that the raindrops tend to be larger. Rainfall in winter comes mainly from stratiform clouds in the form of light rain or drizzle. Rain gauges and weather radars are two major methods for measuring or estimating rainfall amount but neither of them can provide data on the size distribution of raindrops. Disdrometer can supplement and provide such measurement information.
The disdrometer installed by the Observatory at the Aeronautical Meteorological Station in Chek Lap Kok is a Two-Dimensional Video Disdrometer (2DVD; Figure 1). The most important part of the instrument is the measurement area in the center, which is about 10 centimeters long and wide and looks like a “compluvium”, flanked by high-speed scanning cameras on both sides. When a raindrop falls through the measurement area, its sections at different heights are photographed. After processing the observation data by software, the fall speed of the raindrop and even its three-dimensional shape can be reconstructed (Figure 2). During rainfall, the disdrometer can measure each raindrop in milliseconds (thousandths of a second). Taking the heavy rain case on 7 September 2023 as an example, the Hong Kong International Airport at Chek Lap Kok was affected by a rain area with rainfall rate over 30 millimeters per hour (Figure 3). The disdrometer measured more than 140,000 raindrops within the 6-minute interval between 9:54 p.m. and 10:00 p.m. Plotting the fall speed and oblateness data against diameter of these 140,000+ raindrops on two-dimensional histograms (Figure 4), one can observe that the data are not randomly distributed but roughly follow a specific relationship, namely, the larger the raindrop, the higher the fall speed, and the smaller the oblateness and farther away from 1 (that is, the raindrop is more flattened with smaller vertical extent and larger horizontal extent).
Upon acquiring the disdrometer data after each rainy event, not only can the dataset be compared with the conventional rainfall rate and rainfall amount recorded by rain gauges, but radar reflectivity can also be derived from basic physical principles for comparing with weather radar data. This helps to identify the characteristics of raindrops under different precipitation mechanisms in different seasons.
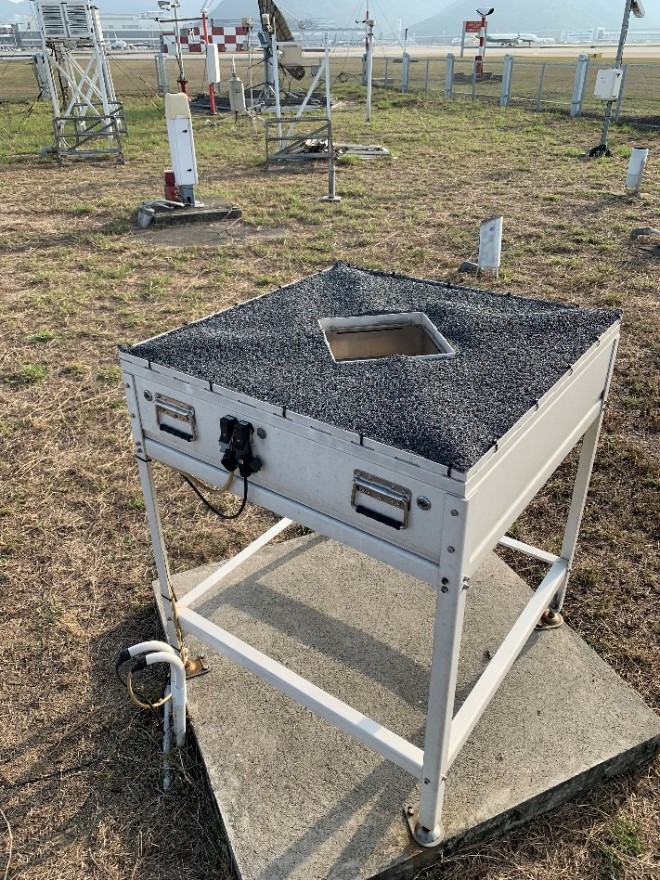
Figure 1 Two-Dimensional Video Disdrometer (2DVD) installed at Chek Lap Kok Aeronautical Meteorological Station.
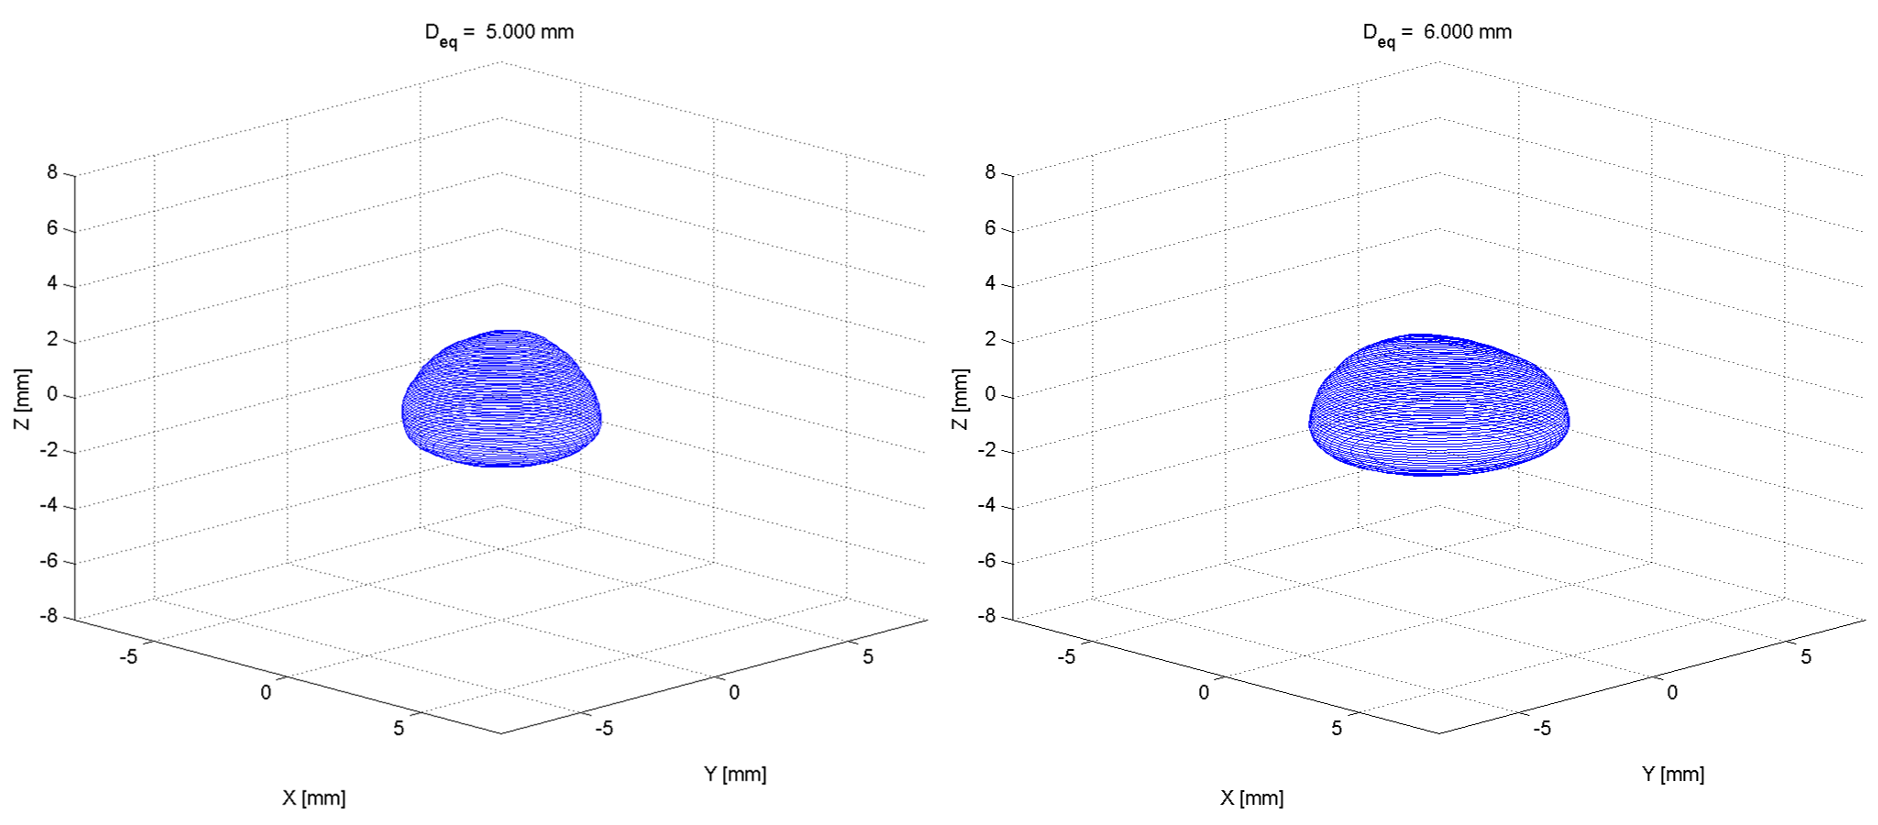
Figure 2 Reconstruction of three-dimensional shapes of raindrops with equivolumetric sphere diameters of 5mm (left) and 6mm (right) respectively.
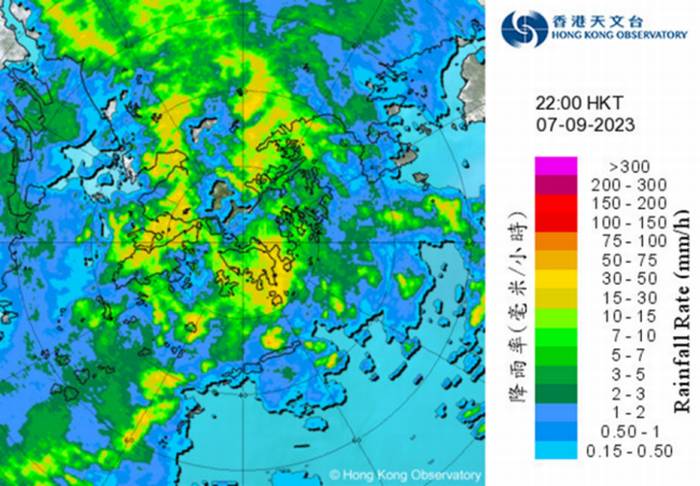
Figure 3 Radar image at 10 p.m. on 7 September 2023 showing a rain area with rainfall rate over 30 mm/h affecting the Hong Kong International Airport at Chek Lap Kok.
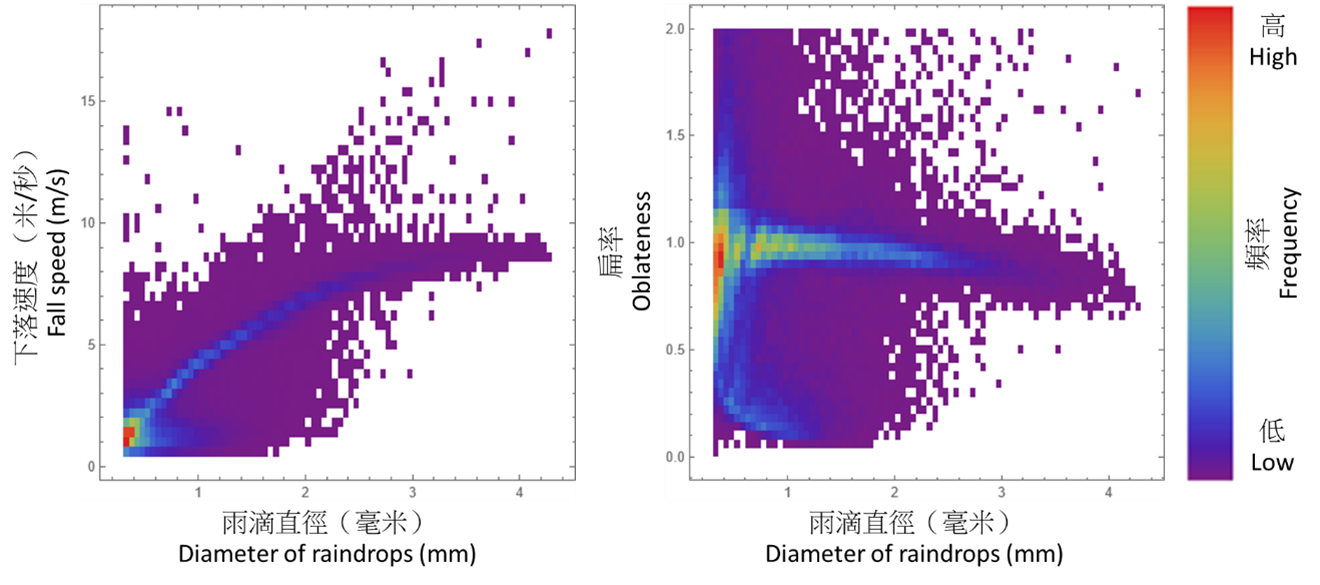
Figure 4 Two-dimensional histograms with raindrop fall speed (left) and oblateness (right) plotted against raindrop diameter. Regions with more reddish colour represent higher counts of raindrops. The larger the raindrop, the higher the fall speed and the smaller the oblateness and farther away from 1, meaning that the raindrop is more flattened with smaller vertical extent and larger horizontal extent.
Reference:
[1] Kruger, A. and Krajewski, W. (2002). Two-Dimensional Video Disdrometer: A Description. Journal of Atmospheric and Oceanic Technology 19(5) pp. 602-617.
[1] Kruger, A. and Krajewski, W. (2002). Two-Dimensional Video Disdrometer: A Description. Journal of Atmospheric and Oceanic Technology 19(5) pp. 602-617.