Assessing Atmospheric Stability by Tephigram
Assessing Atmospheric Stability by Tephigram
KWAN Kam-lun and WONG Sau-ha
February 2018
Atmospheric stability and the occurrence of weather phenomena are highly related. For example, radiation fog forms under relatively stable atmospheric condition, whereas strong convection may occur when the atmosphere is unstable.
Atmospheric stability is related to how temperatures and humidity change with height. Put it simple, atmospheric pressure decreases with height. When an air parcel rises, it expands as atmospheric pressure decreases. As it expands, the air parcel’s temperature drops following the law of conservation of energy. If the air parcel is unsaturated, the temperature will drop at a rate of 9.8 degree Celsius for a rise of 1 kilometer in height (known as the dry adiabatic lapse rate), and at the moist adiabatic lapse rate if the air is saturated with moisture. If this rising air parcel, after cooling, is warmer than the ambient air, it will keep rising due to its lower density (unstable atmosphere). On the other hand, if the rising air parcel is colder than the ambient air, it will descend back to its original position due to its own weight (stable atmosphere) (see Figure 1).
From the above, we understand that atmospheric stability can be determined by examining how the actual air temperature and humidity change with height. Conventionally, changes in vertical temperature and humidity are obtained from the measurement using a sounding balloon. A quick way of determining whether the atmosphere is stable or not is to plot the sounding data on a chart called tephigram (see Figure 2). By comparing the observed temperature curve against the curves of dry/moist adiabatic lapse rates, the stability at different heights of the atmosphere can be determined. When the observed temperature curve (in black) lies to the right of the lapse rate curve, the atmosphere is stable; and when it lies to the left, the atmosphere is unstable. In an unstable atmosphere, a disturbed air parcel will keep rising up and cooling down until its water vapour content condenses into cloud droplets; or further gathers into rain when the air is moist enough. In case the upward motion of the air parcel (updraft) is severe, thunderstorms may develop.
The tephigram is therefore very useful for determining if the atmospheric condition is suitable for performing outdoor activities, especially aviation sports such as paragliding. Gliders do not have engine propulsion but rely solely on the updrafts and the winds in the lower atmosphere to keep it in the air. A very stable atmosphere with weak updrafts and light winds is unfavourable to such flying activities. On the other hand, when the atmosphere is very unstable, there could be rain or even thunderstorms and thus even less suitable for flying. An analysis of the prevailing stability condition on whether there would be suitable updrafts is crucial to a safe and enjoyable paragliding exercise.
As seen from Figure 2, there are many lines on a tephigram. They actually serve different purposes and will be introduced later.
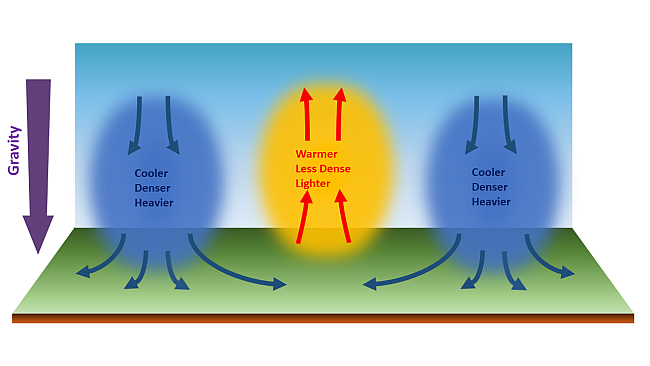
Figure 1 An air parcel with temperature higher than its surrounding air will have lower density and thus rise due to buoyancy, forming an updraft.
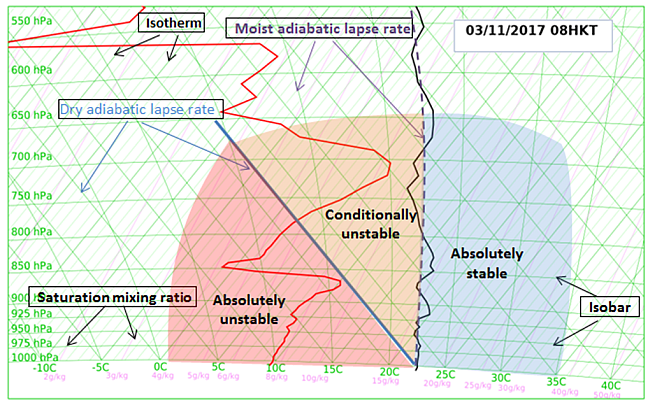
Figure 2 The air temperature is drawn in black line and the dew point temperature in red. Larger separation of the black and red lines indicates drier air . When the two lines are close to each other, the air is more humid and there may be cloud formation. Height on the tephigram is expressed in barometric units. Straight lines inclined at 45 degrees to the right are isotherms. Straight lines inclined at 45 degrees to the left are the dry adiabatic lapse rate. Vertical curved lines indicate the moist adiabatic lapse rate. Pink lines inclined to the right are the saturation mixing ratio, which represents the water content of saturated air at a certain temperature.