What is Climate Projection?
What is Climate Projection?
LAI Wang-chun Andy
May 2023
Ever since the Industrial Revolution, human activity has produced huge amounts of greenhouse gases, causing global climate to warm with increasing occurrence of extreme weather events. The impacts of human-caused climate change are clear. One may ask: what are the climate challenges that mankind has to face for the rest of this century? In fact, climate scientists around the world have done a lot of research on related issues and made future climate projections for Earth through the assessment reports regularly published by the Intergovernmental Panel on Climate Change (IPCC). To understand what climate projections are, one must first understand the difference between weather forecasts and climate projections.
Weather forecasts
Based on atmospheric and oceanic conditions observed at present or in the recent past, numerical weather prediction models are employed to forecast weather for the next few days, depicting day-to-day and even hour-to-hour variations. The forecast content can include temperature, humidity, air pressure, wind direction, wind speed, rainfall, etc. Parameters exhibiting little fluctuations (e.g, ocean temperature, atmospheric concentrations of greenhouse gases) on timescales of short-term weather do not have a large impact on the forecasts.
Climate projections
Global climate depends on the energy balance of Earth. For example, Earth will warm if the amount of energy entering Earth exceeds that leaving Earth. However, the amount of human-caused greenhouse gases emissions is not governed by physical laws, but is affected by many unpredictable factors, such as the development of countries around the world, the supply of low-carbon energy, the development of energy-saving technologies, the formulation and implementation of emissions reduction policies, lifestyle and behavioral habits, etc. Hence, scientists must make assumptions of possible greenhouse gas emissions scenarios and simulate future changes in the atmosphere and oceans using computer climate models under the assumptions of these scenarios, i.e. making climate projection (Figure 1). According to the current level of technology, computer climate models can simulate the changes in long-term average of atmospheric and oceanic parameters, but they still cannot effectively simulate year-to-year variations. Hence, climate projections are generally expressed in terms of 20-year averages. Projections can include air temperature, rainfall, ocean temperature, sea level, sea ice area, etc.
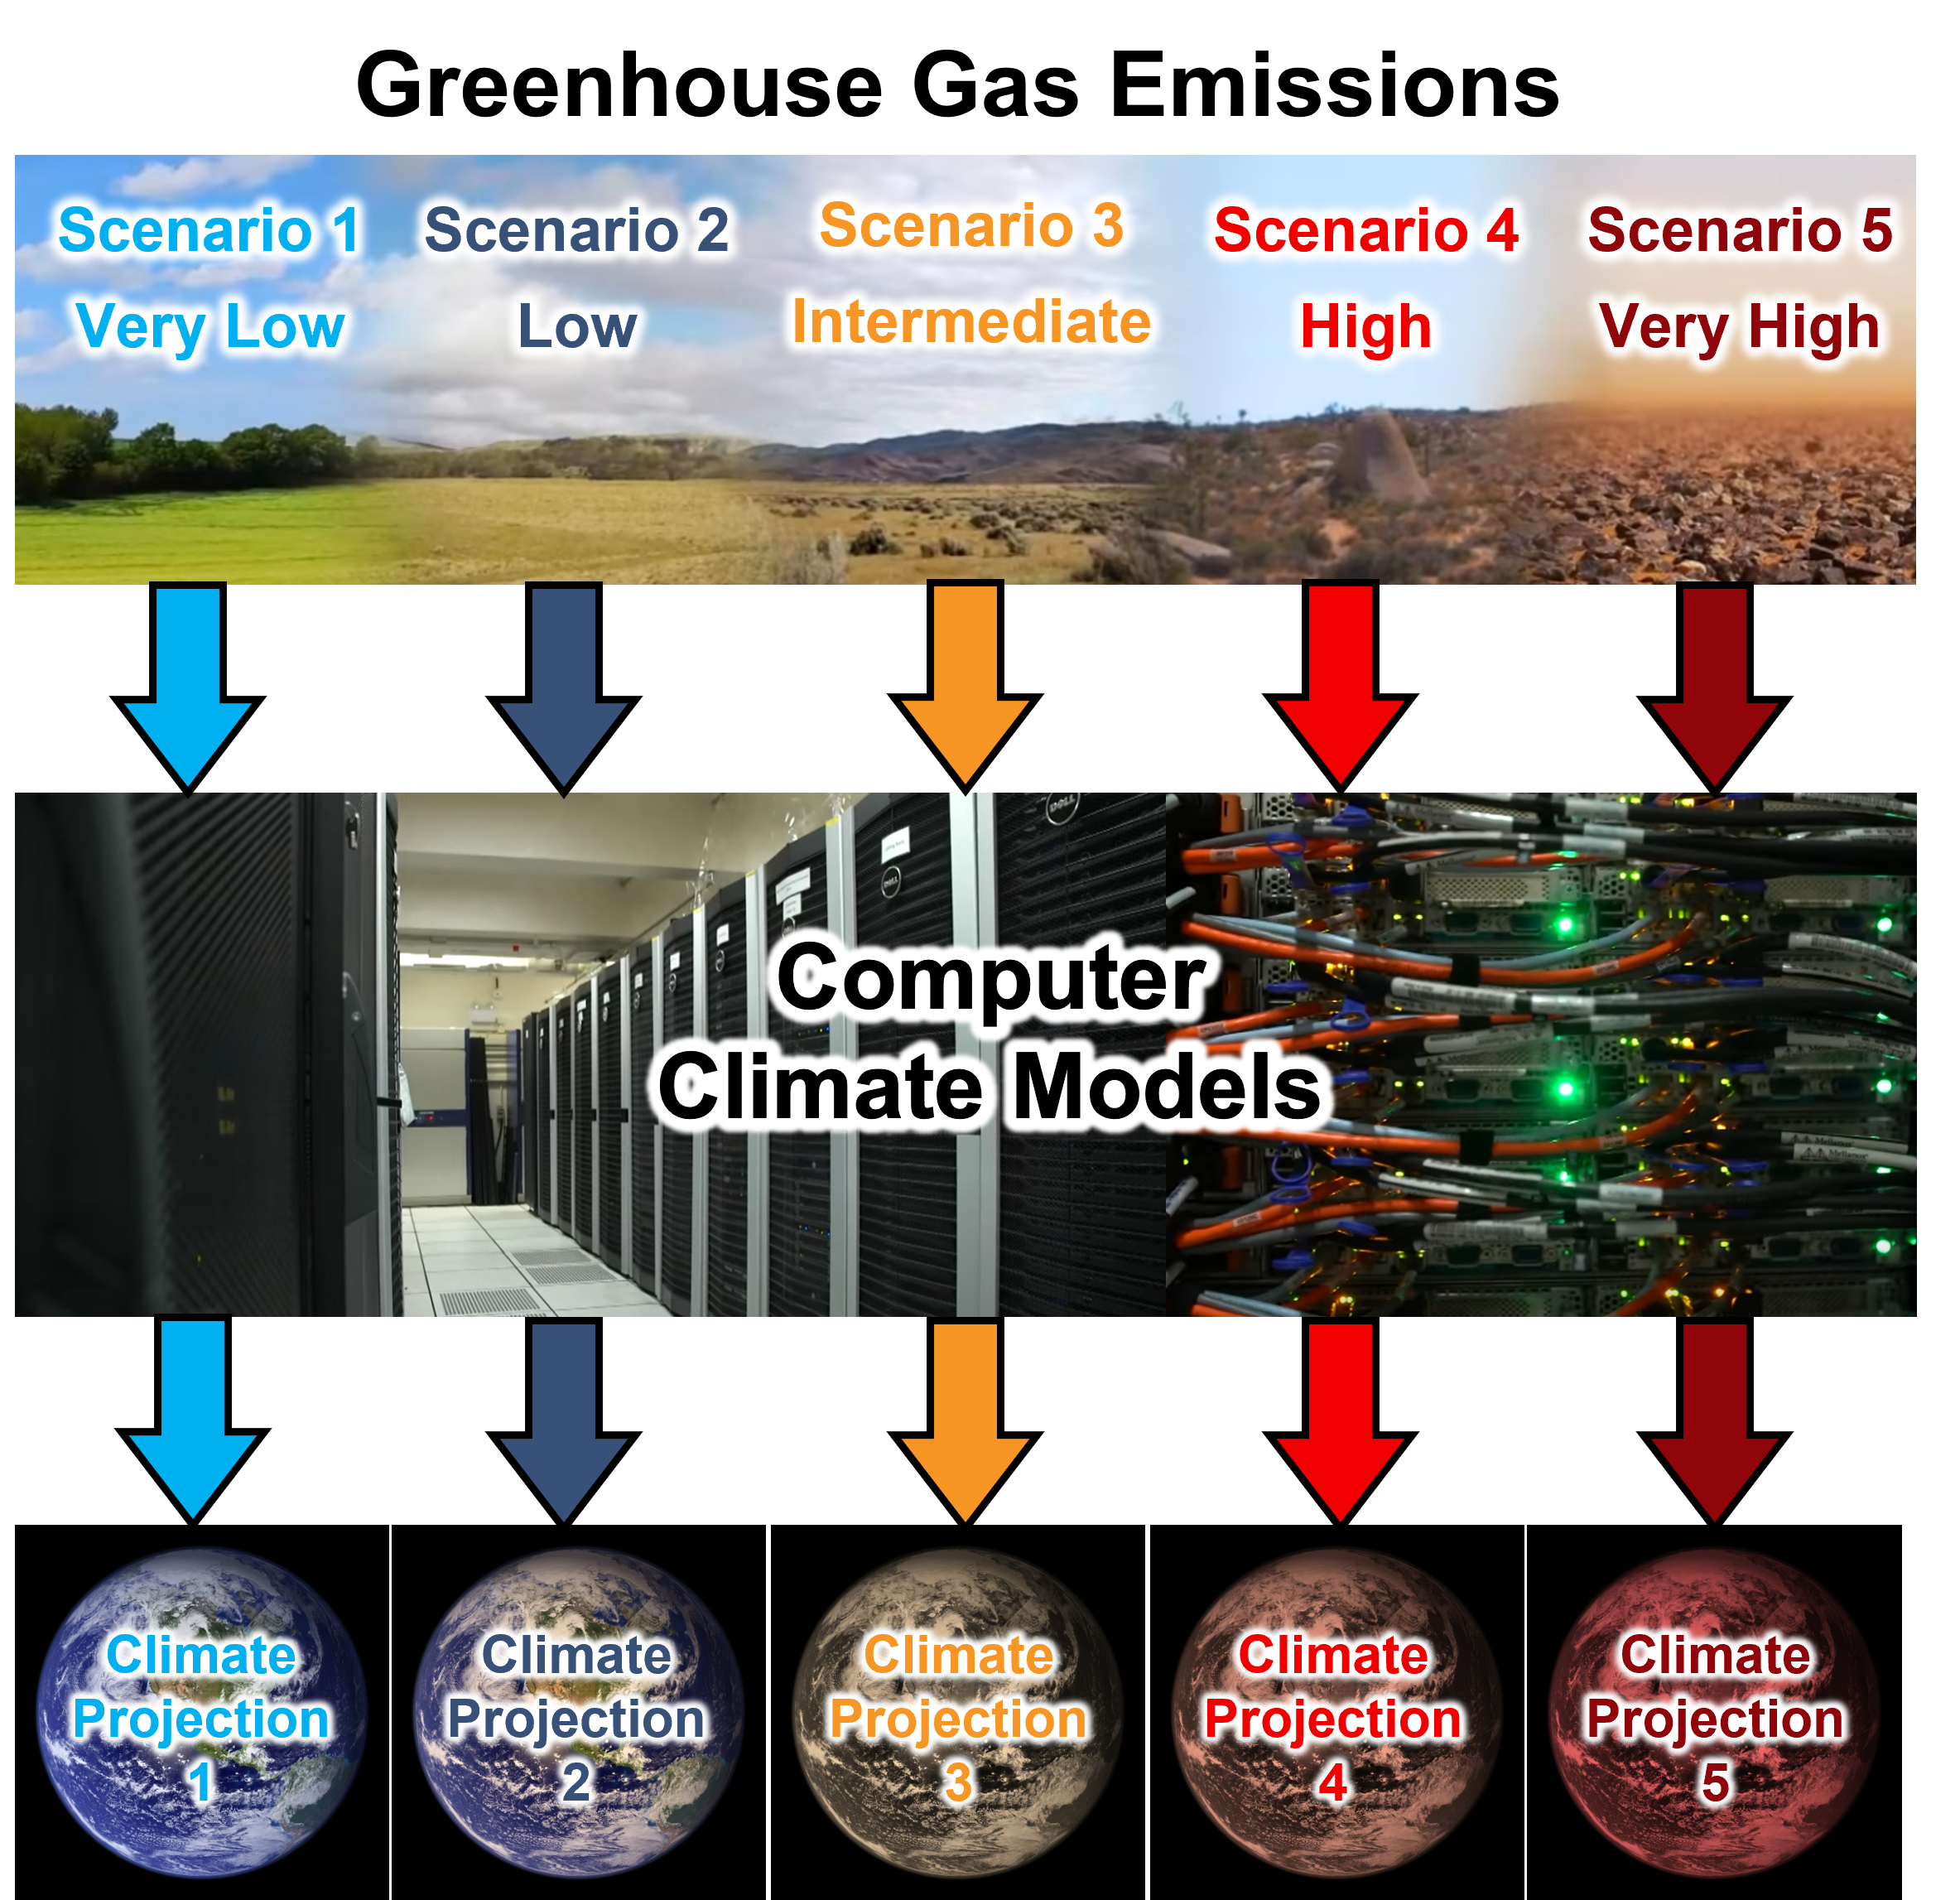
Figure 1 The processes of climate projections.
IPCC released the Working Group I contribution to the Sixth Assessment Report (AR6) “Climate Change 2021: The Physical Science Basis” in August 2021. A new set of 5 scenarios taking into account various trends of greenhouse gas concentrations is employed in AR6 to generate climate projections for the 21st century. Taking temperature as an example, compared to 1850-1900, global mean surface temperature in 2081-2100 is very likely to be higher by 2.1-3.5℃ and 3.3-5.7℃ under the intermediate (SSP2-4.5) and very high (SSP5-8.5) greenhouse gas emissions scenarios respectively.
| SSP5-8.5 | Very high greenhouse gas emissions Carbon dioxide emissions roughly double from current levels by 2050. |
| SSP3-7.0 | High greenhouse gas emissions Carbon dioxide emissions roughly double from current levels by 2100. |
| SSP2-4.5 | Intermediate greenhouse gas emissions Annual carbon dioxide emissions remaining at around current levels until mid-century, but gradually declining afterwards. |
| SSP1-2.6 | Low greenhouse gas emissions Carbon dioxide emissions decline to net zero at around 2080, followed by net negative emissions. |
| SSP1-1.9 | Very low greenhouse gas emissions Carbon dioxide emissions decline to net zero at around 2050, followed by net negative emissions. |
Table 1 The 5 scenarios of greenhouse gas emissions used in “Climate Change 2021: The Physical Science Basis”.
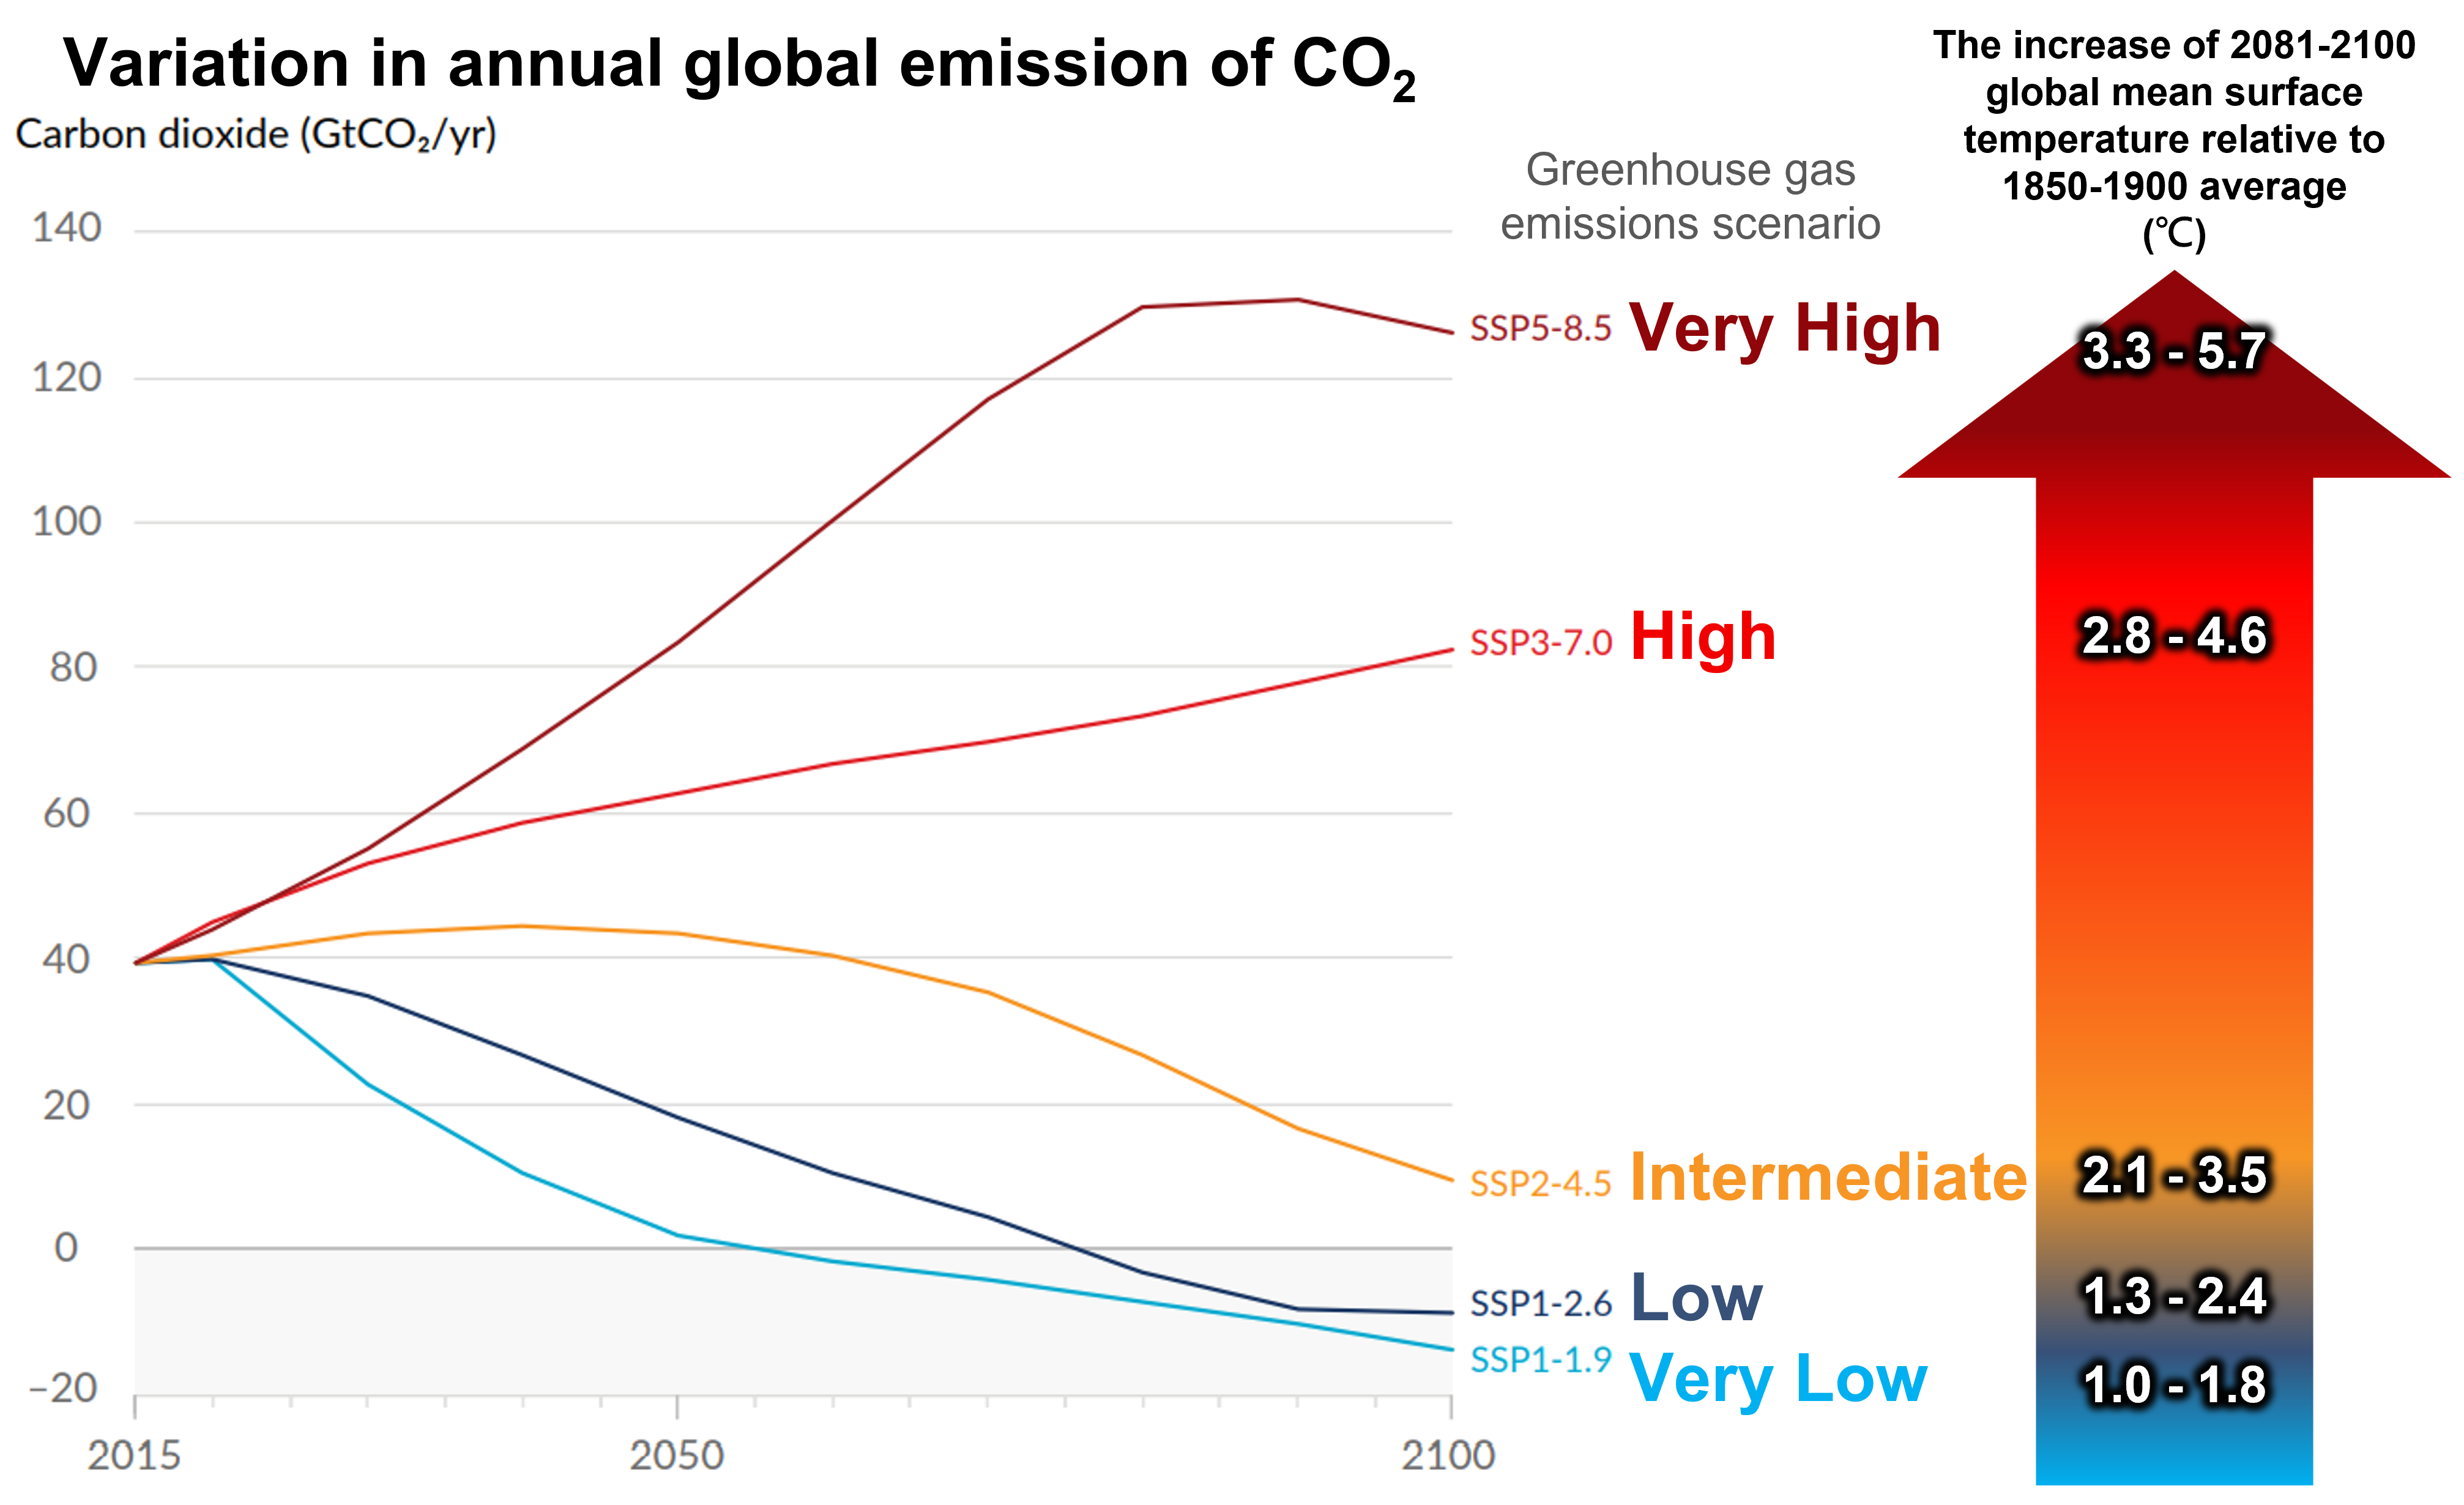
Figure 2 (left) Variation in annual global emission of carbon dioxide under different greenhouse gas emissions scenarios (from Climate Change 2021: The Physical Science Basis, Summary for Policymakers.); (right) the increase of 2081-2100 global mean surface temperature relative to 1850-1900 average under different greenhouse gas emissions scenarios.
Climate projections provide important reference for climate change adaptation planning. For example, infrastructure design standards are revised based on projections of rainfall and sea level rise in order to cope with more intense rainfall, higher sea levels, stronger tropical cyclones and the associated threats of storm surge in the future.
For details of the projections, please refer to the “Global Climate Projections” and “Hong Kong Climate Projections” on the Observatory's website.