A Brief Introduction to Standardized Precipitation Index (SPI)
A Brief Introduction to Standardized Precipitation Index (SPI)
WU Man-chi
September 2013
Deficit of rainfall over a period of time at a certain location could lead to various degrees of drought conditions, affecting water resources, agriculture and socio-economic activities. Since rainfall varies significantly among different regions, the concept of drought may differ from places to places. As such, for more effective assessment of the drought phenomena, the World Meteorological Organization (WMO) recommends adopting the Standardized Precipitation Index (SPI) to monitor the severity of drought events.
In simple terms, SPI is a normalized index representing the probability of occurrence of an observed rainfall amount when compared with the rainfall climatology at a certain geographical location over a long-term reference period. Negative SPI values represent rainfall deficit, whereas positive SPI values indicate rainfall surplus. Intensity of drought event can be classified according to the magnitude of negative SPI values such that the larger the negative SPI values are, the more serious the event would be. For example, negative SPI values greater than 2 are often classified as extremely dry conditions.
Moreover, SPI enables rainfall conditions to be quantified over different time scales (e.g. 3-, 6-,12-, or 24-month rainfall), facilitating the analyses of drought impact on various water resource needs. For example, SPI-3 measures rainfall conditions over a 3-month period, the anomalies of which impact mostly on soil water conditions and agricultural produce; while SPI-24 measures rainfall conditions over two years, as prolonged droughts can give rise to shortfalls in groundwater, stream flow, and fresh water storage in reservoirs.
An advantage in using SPI is that only rainfall data are needed for its computation. SPI can also be compared across regions of different climatic zones. For more information about the methodology and applications of SPI, please refer to the WMO guideline.
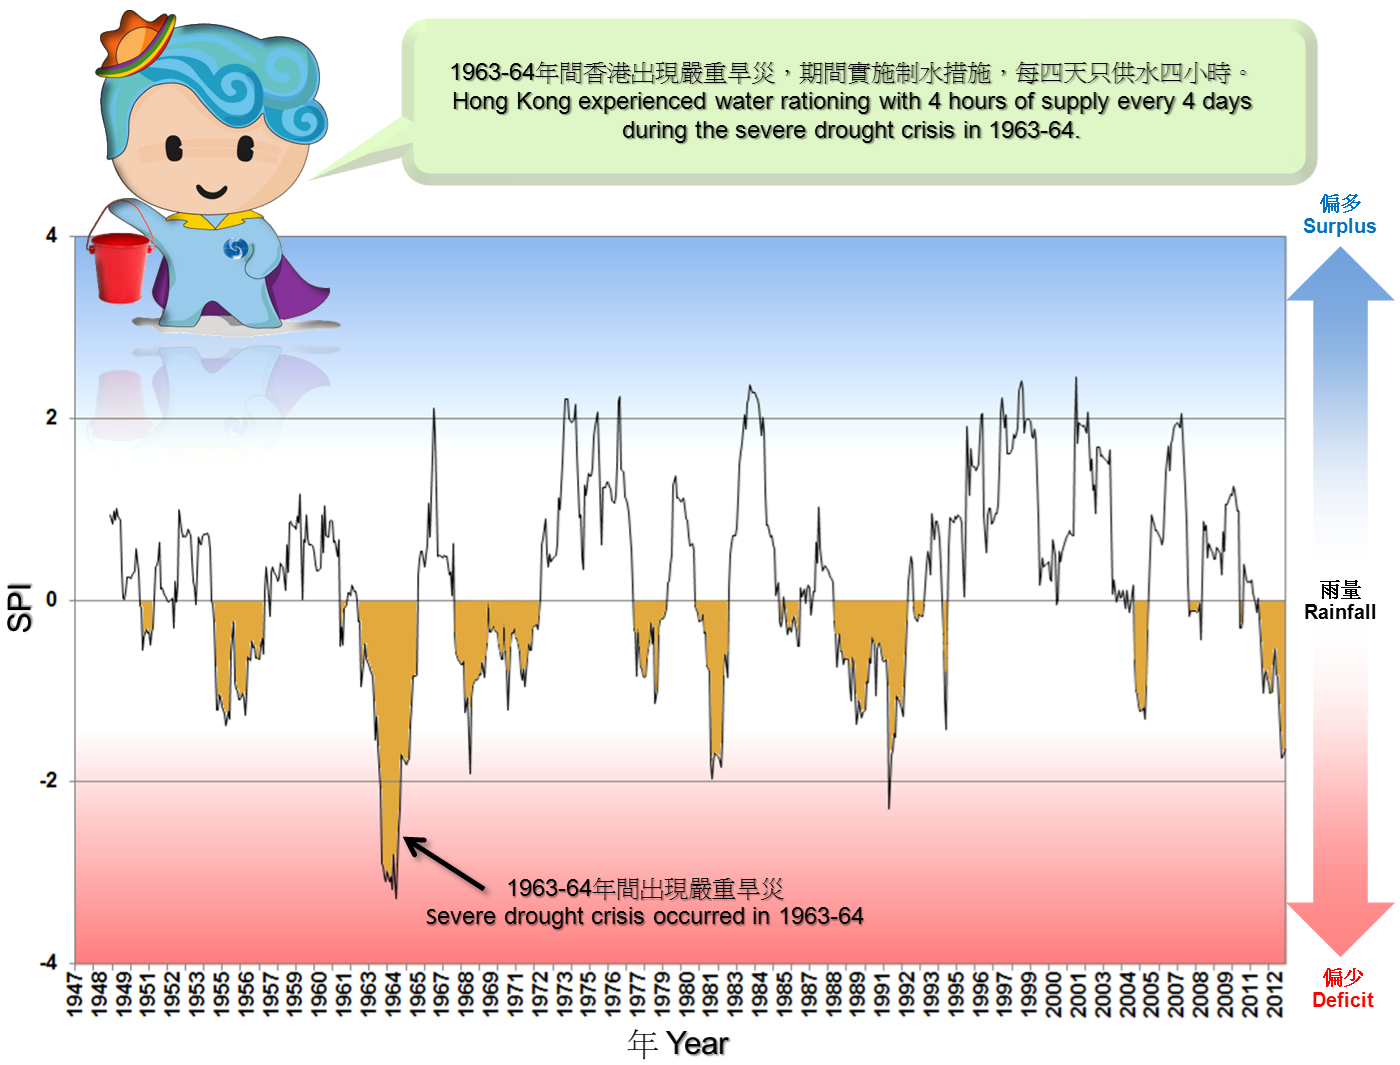
Figure 1 Variation of SPI-24 in Hong Kong from 1947 to 2012