Return Period: “Once in N Years”?
Return Period: “Once in N Years”?
WONG Yat-chun
April 2022
Sometimes we may hear such a description for an extreme weather event: “once in N years”. Does that really mean we would encounter such an event once every N years?
What is return period?
The number “N” actually refers to a statistical concept called “return period”. The calculation of return period is shown in the figure below (Figure 1): first, from the existing data, we calculate the probability of a certain event to happen within a certain period of time (rate of occurrence, μ) through statistical methods, and we take its reciprocal (1 ÷ μ). Then we would know the average time separation between occurrences of such event. This is called the return period.
The choice of statistical methods would affect the estimation of return periods. Taking the fictitious rainfall data in Figure 1 as an example, the time series on the far left shows 2 occurrences of exceeding 100 mm within that 50 years. If we estimate the rate of occurrence in the simplest way, that would be once in every 25 years, so the return period would be 25 years; but if we first estimate the long-term theoretical rainfall distribution from the limited data, and represent it with a smooth curve before we carry out the estimation of the return period, we would get what is being shown in Figure 1: the return period is estimated to be 50.0 years.
Furthermore, we should also note that geographical and climatic factors vary in different regions, so even for the same event, the occurrence rate as well as the corresponding return period in different regions can be very different.
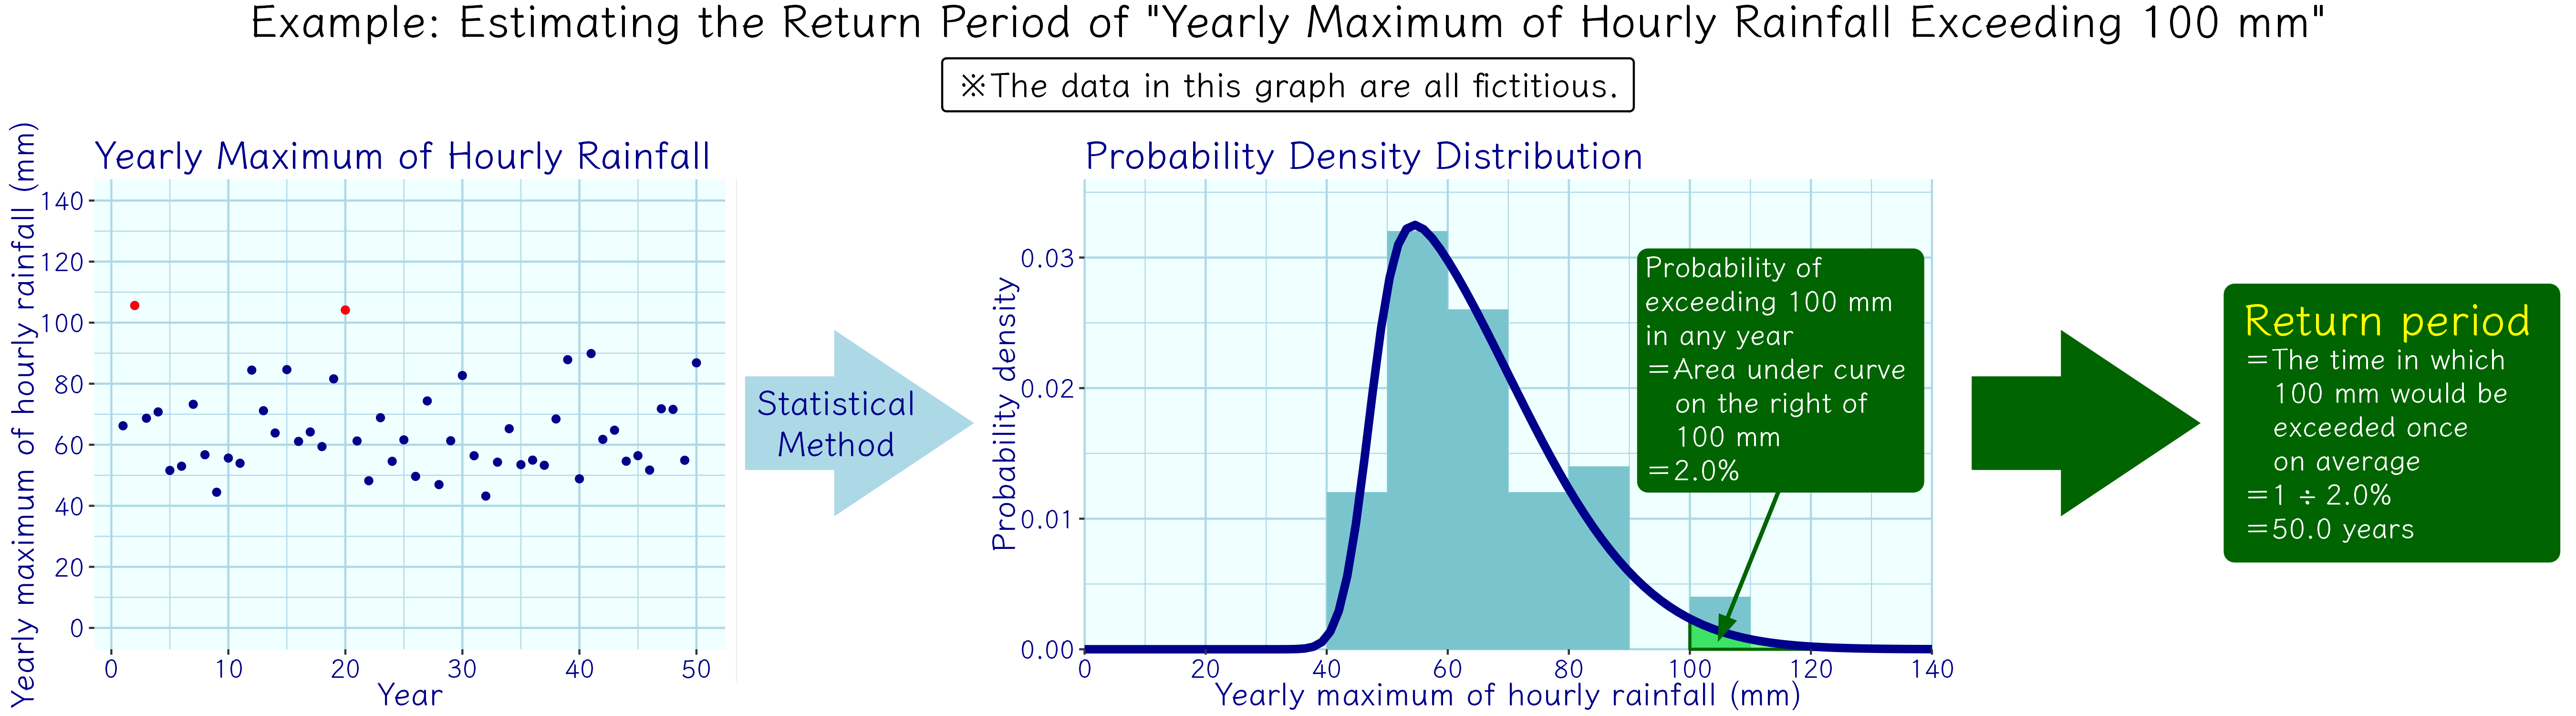
Figure 1 An example of estimation of return period. (The data in the figure are all fictitious and used for example only.)
To correctly understand return period
We should be careful and understand return period correctly: return period is a long-term average, an expected value derived from probability. Even if the return period is N years, it does not mean that the event would eventually occur within N years. In particular, the occurrence of extreme events is quite random, and the time between each occurrence may vary greatly: it may happen not even once in the N-year period, but it may also happen several times in another N-year period. It is just that: from a statistical perspective, it happens once in N years on average. Taking the fictitious rainfall data in Figure 1 as an example, the time series on the far left shows that hourly rainfall over 100 mm occurred in the 2nd year and the 20th year with an interval of 18 years, but such event did not occur again in at least the following 30 years. While our estimation of the return period is 50 years, we could only say that the first two occurrences being only 18 years apart is a coincidence.
Although return period is not a guarantee of when an event would occur, it does provide an objective figure to show the rareness and extremeness of an event, which is useful for deciding engineering standards, risk management, and academic research. As a long-term average, return period is a representative figure. The longer the return period, the rarer and more extreme the event.
The estimation of return period for extreme events
The rare occurrence of extreme events also poses a challenge on the estimation of its return period. As the data we used to estimate the rate of occurrence has a limited length of available period, the data for extreme events are prone to be insufficient, which would in turn affect the accuracy of the estimation. Some very extreme events may even have never happened since the start of record. In that case, we could only estimate by extrapolation from existing data through statistical methods, or by extracting the data of future predictions from numerical models. As the data for extreme events are few from the beginning, one or two additional extreme events may already have a large impact on the estimation results (See Figure 2 below). In other words, estimates for extreme events are very sensitive to new observations, so it is not surprising that the estimated return periods may change dramatically as more observations are made.
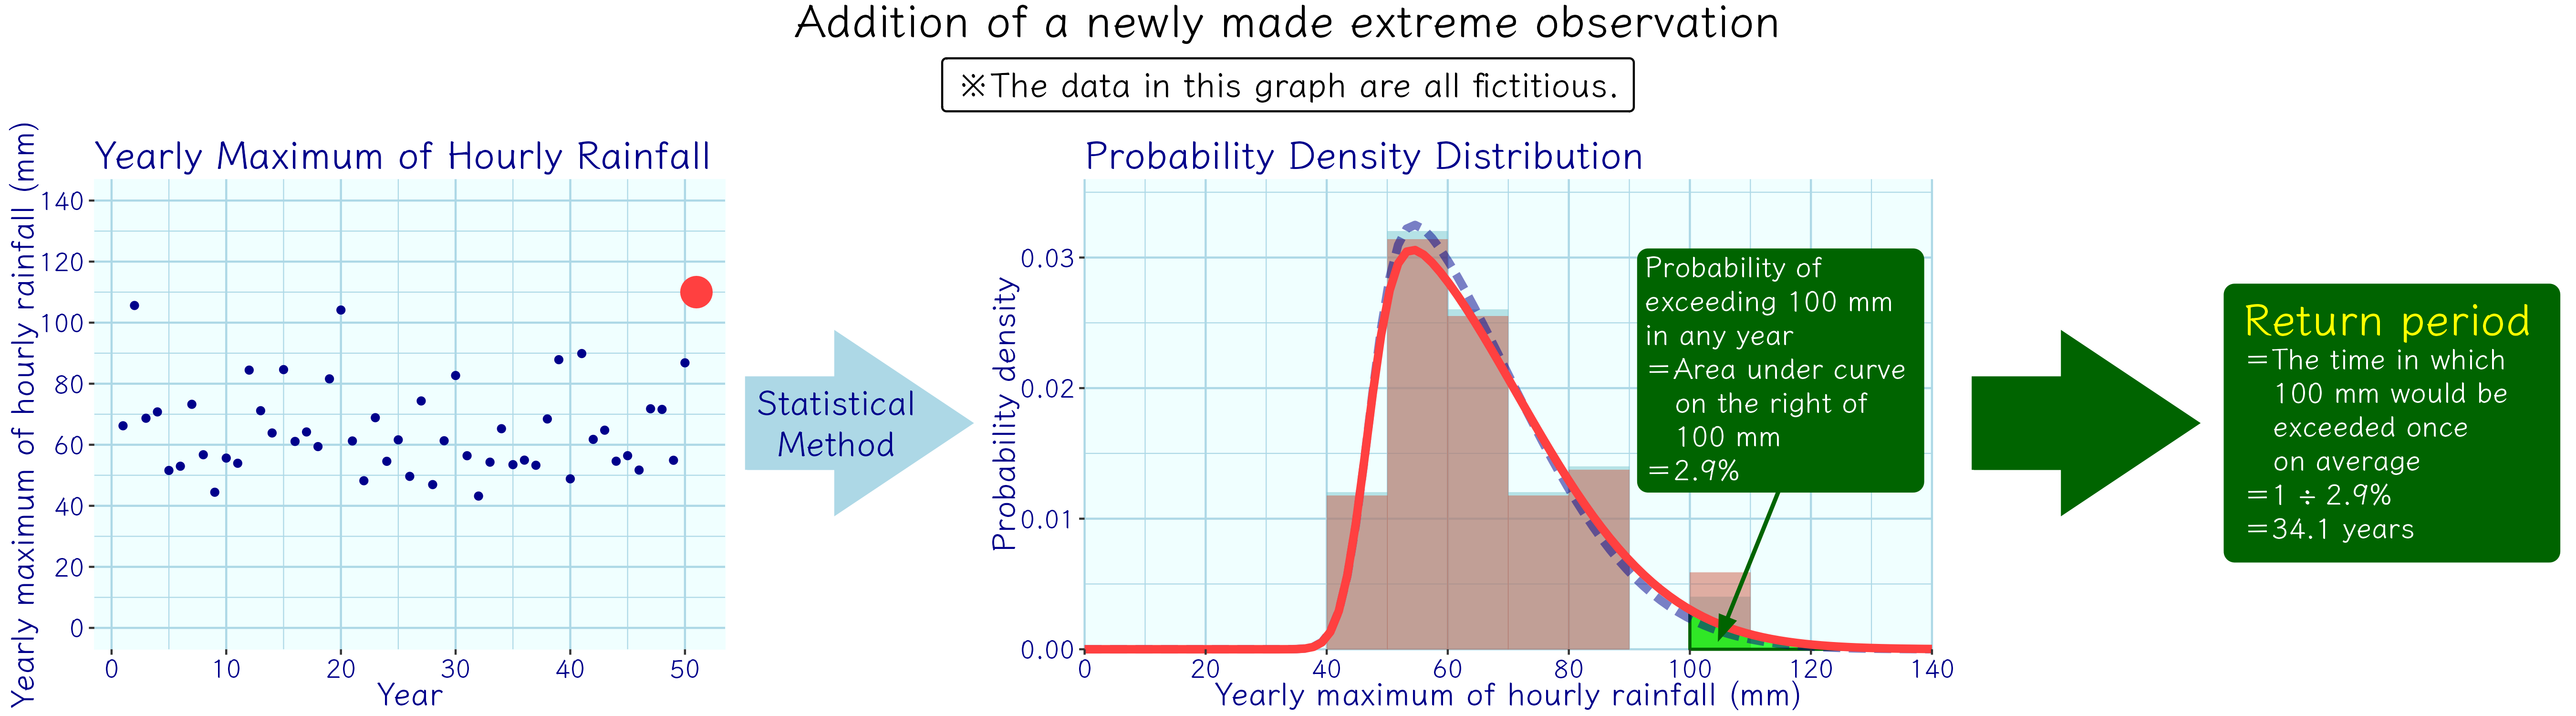
Figure 2 Addition of a newly made extreme observation on top of Figure 1. The red point is the new observation. The red solid line is the newly fitted probability density distribution curve; the blue dashed line is the old one. After the addition of a newly made extreme observation, the return period changes from the previously estimated 50.0 years in Figure 1 to 34.1 years.(The data in the figure are all fictitious and used for example only.)
Climate change will also lead to changes in return periods
The background environment has been changing under climate change. Just as the old saying in the stock market goes, “past performance is no guide to future performance”. We could expect the return periods of various events would also change. If we use past data in our estimation, the estimated return periods would inevitably lag behind, affecting its representativeness. On the other hand, numerical climate models generally predict that extreme weather events would become more extreme and frequent in the future under climate change, implying shortening of return periods as time evolves.
Extreme events are becoming more frequent, and this is a challenge that we all must be prepared to face in the midst of climate change. For more information on climate change, please visit our “Climate Change” webpage.