Endless wildfires
Endless wildfires
SHAM Fu-cheung
June 2020
According to the analysis of the World Meteorological Organization, 2019 was the second warmest year on record globally, with the past five years, 2015-2019, being the five warmest on record. Under global warming, extreme hot weather events ravaged different parts of the world. For example, Australia registered the hottest summer on record between the end of 2018 and early 2019. In December 2019, a high temperature near 50°C was recorded in southern Australia. Europe could not be spared and was hit by heatwaves twice within a month between late June and late July 2019. In the first heatwave, France registered a record breaking temperature of 46°C. The second heatwave was more pervasive, breaking high temperature records in Germany, the Netherlands, Belgium, Luxembourg and the United Kingdom. During the two heatwaves, more than 1,400 excess deaths as compared with the average were observed in affected regions.
Very often, hot weather is accompanied by wildfires (also known as bushfires and forest fires), especially in dry environment. In June 2019, more than a hundred intense and long-lived wildfires occurred in the Arctic Circle. In the same year, the Amazon forest experienced the most active fire season since 2010. Yet, the most significant wildfire in 2019 was the Australian bushfires which occurred in the second half of the year. The bushfires began in Queensland in September 2019, spreading south to New South Wales and Victoria (Figure 1), and gradually became under control in March 2020. The bushfires have killed many people, destroyed hundreds of homes and burned large areas of land, causing massive devastation to ecosystems and the environment. Analyses showed that the bushfires had burned 21 per cent of Australia’s forests, far exceeding similar records in other continents over the past 20 years. In addition, scientists estimated that 800 million animals were killed by the fires in New South Wales alone, and the total number of animals killed exceeded 1 billion for the whole nation.
Is this extreme bushfire event a random event, or its chance of occurrence has been enhanced by climate change? We can get some clues from the climate report published by the Bureau of Meteorology, Australia. The temperature of Australia has risen by 1°C since 1910, leading to an increase in the frequency of extreme heat events. In southeastern Australia, there has been a decline of around 11% of April-October rainfall since the late 1990s, and there is a long-term increasing trend in the Forest Fire Danger Index (Figure 2). 2019 was the warmest and driest year on record for Australia, setting the scene for the bushfires. In fact, many studies have pointed out the link between climate change and Australian bushfires. For instance, climate change made the 2018 Queensland bushfires four times more likely; and climate change will make firestorms more likely in southeastern Australia.
In light of the Australian bushfires, scientists have reviewed recent research results and drawn the conclusion that human-induced climate warming has already led to a global increase in the frequency and severity of fire weather, increasing the risks of wildfire. Wildfires not only pose direct threat to lives and properties but also release pollutants detrimental to human health and ecosystems (Figure 3). In addition, carbon dioxide released by wildfires exacerbates the greenhouse effect. Natural factors that trigger wildfires (e.g. lightning) are beyond human control. However, reducing greenhouse gas emissions to mitigate climate change impact could be under human's control. The threats of climate change on the human daily lives and the ecosystems are imminent. We must make every effort to combat climate change proactively.
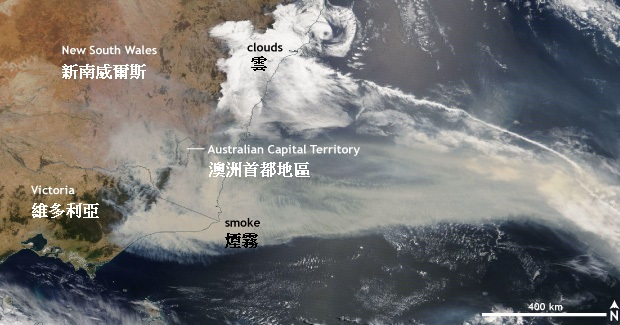
Figure 1. A river of smoke from bushfires in Victoria and New South Wales, Australia, on 2 January 2020. (Source: National Aeronautics and Space Administration, US)
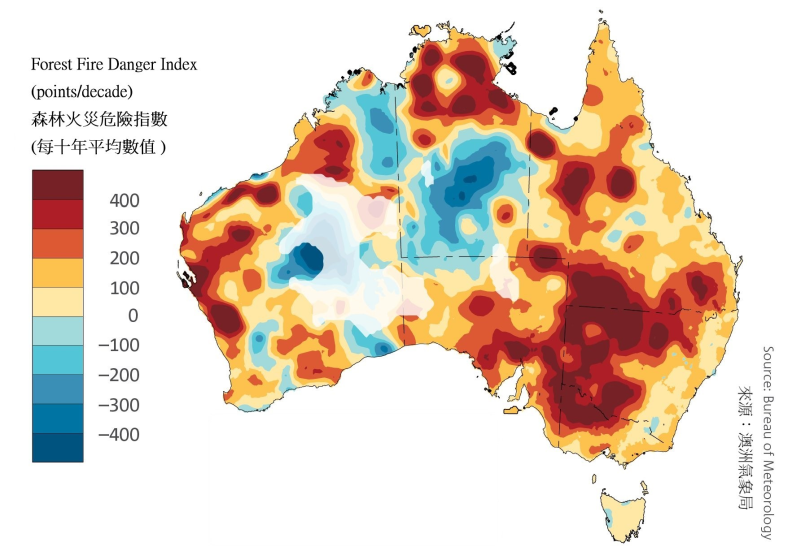
Figure 2. Trends from 1978 to 2017 in the annual sum of the daily Forest Fire Danger Index. Positive trends are indicative of an increasing length and intensity of the fire weather season. (Source: Bureau of Meteorology, Australia)
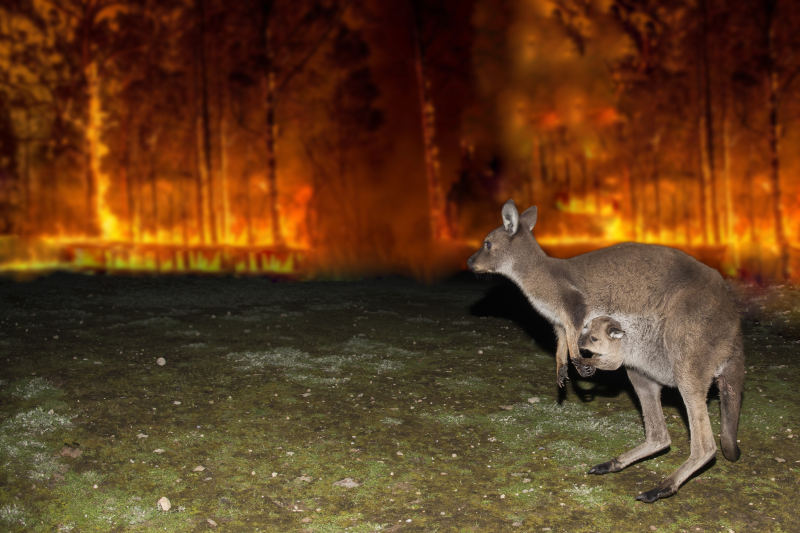
Figure 3. Wildfires devastating ecosystems.