Geographic Information System (GIS) is an integrated spatial information system that possesses the capability of storing, managing, analysing, displaying and exploiting geographic information. Meteorological data almost invariably come with spatial information, such as vertical distance above the ground level (or atmospheric pressure level), latitude and longitude, etc. It is most appropriate to process meteorological data using GIS technology.
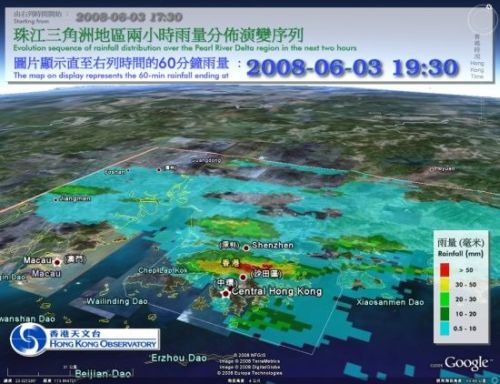
Since as early as 2008, the Hong Kong Observatory has been using GIS technology to present the predicted rainfall distribution over the Pearl River Delta Region including Hong Kong in the coming two hours (Figure 1). Through a geospatial information display software, users can zoom in, zoom out and configure panoramic view operation in order to appreciate the spatial coverage of the rain areas.

|
| Figure 1 Rainfall forecast for the Pearl River Delta Region |
In recent years, open source GIS technology has been developing rapidly, the practicality and functionality of such systems have improved. The Observatory began to adopt open source GIS technology and developed the new-generation meteorological analysis system for use by weather forecasters in 2011. One of the most salient features of the system is that it can orderly display a wide variety of real-time meteorological information, including the automatic weather station data, radar and satellite imageries, upper-air sounding data, lightning location information, as well as numerical weather predication (NWP) model products, etc. on the same platform.
As different types of meteorological data carry different characteristics, it is necessary to apply the appropriate method of data processing according to the characteristics of the data in order to achieve the best results. GIS is able to handle vector[Note] data effectively, it is also capable of handling data in graphical format. For the latter type of data, we have to produce a set of images with pre-defined scales to ensure that good resolution can be maintained when zooming at different levels. In addition, when displaying weather images with considerable geographic coverage, such as satellite imagery, it will take more computing resources and longer time for the system to process and transmit the data. The workaround is to split the large images up into a number of small raster images and then transmit only those relevant images to the users simultaneously, so as to reduce the overall data transmission time.
For general meteorological observations, the data can be displayed in vector format. There is no need to pre-generate a large number of images for such data as the resolution of vector images can always be preserved at different zoom levels.
HTML5, a widely-used technology on web browsers, and the open source dynamic map programming library of OpenLayers have been deployed for developing the user interface of the new-generation meteorological analysis system. Through the new features made available with HTML5 technology, users can create drawings on the web page and change the colour configuration instantly, whereas OpenLayers provides common GIS functions, such as overlaying and arbitrary resizing of images.

|
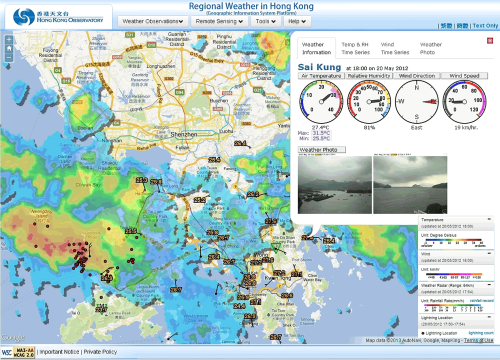
| Figure 2 Regional Weather in Hong Kong |
The "Regional Weather in Hong Kong" webpage (Figure 2) based on the technology of the new-generation meteorological analysis system has been introduced to the Observatory's homepage. Different types of weather observations can be displayed on a detailed base map at user's choice, along with the overlay of other meteorological information like radar images or lightning location information if so wish. With a mouse click on any one of the station symbols, the whole set of observations from the corresponding station can be retrieved and displayed altogether.
With the increasing popularity of tablet computers and mobile devices, it is expected that the effective presentation of meteorological information to such users by way of GIS will become a major direction of development in future.
