Number of observed at the Hong Kong Observatory since 1884, exclude 1940-1946
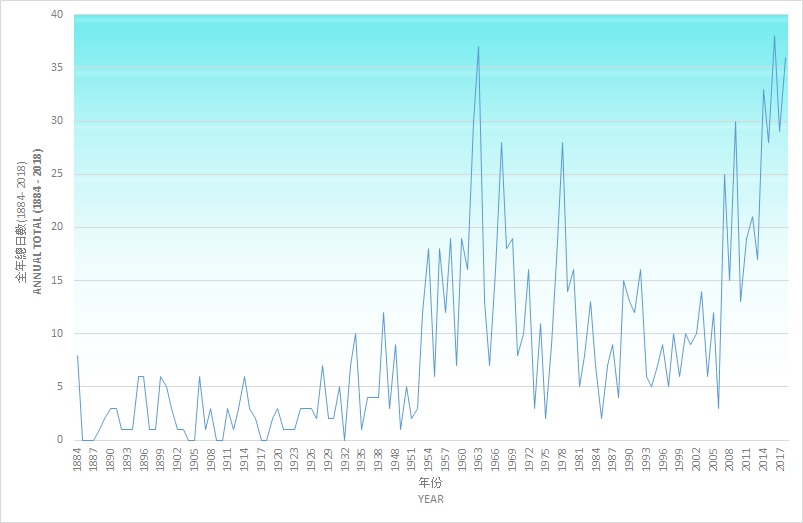
Number of Very Hot days observed at the Hong Kong Observatory since 1884, exclude 1940-1946
(criteria: daily maximum temperature >= 34.0 degrees C)
|
Figure 1. Total number of very hot days observed at the Hong Kong Observatory |
|
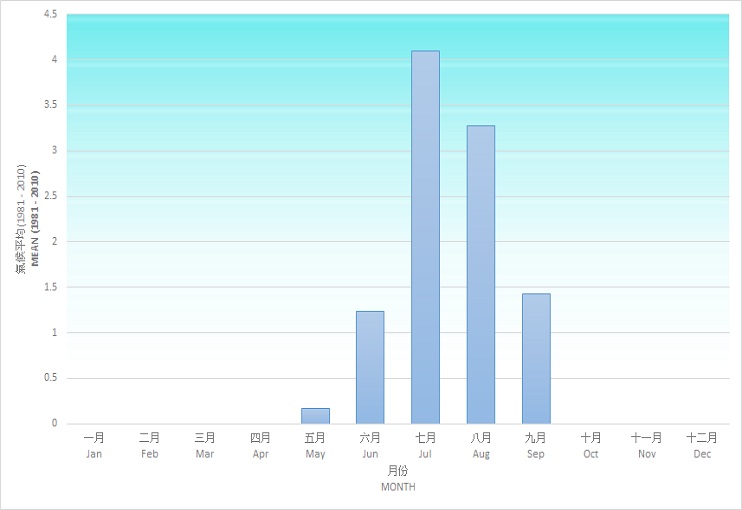
Figure 2. Monthly mean number of Very Hot days observed at the Hong Kong Observatory(1981 - 2010) |
| Year | Jan | Feb | Mar | Apr | May | Jun | Jul | Aug | Sep | Oct | Nov | Dec | Annual Total |
|---|---|---|---|---|---|---|---|---|---|---|---|---|---|
| 1884 | - | - | - | - | - | - | - | - | - | - | - | - | - |
| 1885 | - | - | - | - | - | - | - | - | - | - | - | - | - |
| 1886 | - | - | - | - | - | - | - | - | - | - | - | - | - |
| 1887 | - | - | - | - | - | - | - | - | - | - | - | - | - |
| 1888 | - | - | - | - | - | - | - | - | - | - | - | - | - |
| 1889 | - | - | - | - | - | - | - | - | - | - | - | - | - |
| 1890 | - | - | - | - | - | - | - | - | - | 2 | - | - | 2 |
| 1891 | - | - | - | - | - | - | - | - | - | - | - | - | - |
| 1892 | - | - | - | - | - | - | - | - | 1 | - | - | - | 1 |
| 1893 | - | - | - | - | - | - | - | - | - | - | - | - | - |
| 1894 | - | - | - | - | - | - | - | - | - | - | - | - | - |
| 1895 | - | - | - | - | - | 1 | - | - | 2 | - | - | - | 3 |
| 1896 | - | - | - | - | - | - | 2 | - | - | - | - | - | 2 |
| 1897 | - | - | - | - | - | - | - | - | - | - | - | - | - |
| 1898 | - | - | - | - | - | - | - | - | - | - | - | - | - |
| 1899 | - | - | - | - | - | - | - | - | - | - | - | - | - |
| 1900 | - | - | - | - | - | - | - | 2 | - | - | - | - | 2 |
| 1901 | - | - | - | - | - | - | - | - | - | - | - | - | - |
| 1902 | - | - | - | - | - | - | - | - | - | - | - | - | - |
| 1903 | - | - | - | - | - | - | - | - | - | - | - | - | - |
| 1904 | - | - | - | - | - | - | - | - | - | - | - | - | - |
| 1905 | - | - | - | - | - | - | - | - | - | - | - | - | - |
| 1906 | - | - | - | - | - | - | - | 1 | - | - | - | - | 1 |
| 1907 | - | - | - | - | - | - | - | - | - | - | - | - | - |
| 1908 | - | - | - | - | - | - | - | - | - | - | - | - | - |
| 1909 | - | - | - | - | - | - | - | - | - | - | - | - | - |
| 1910 | - | - | - | - | - | - | - | - | - | - | - | - | - |
| 1911 | - | - | - | - | - | - | - | - | - | - | - | - | - |
| 1912 | - | - | - | - | - | - | - | - | - | - | - | - | - |
| 1913 | - | - | - | - | - | - | - | - | - | - | - | - | - |
| 1914 | - | - | - | - | - | - | - | 1 | - | - | - | - | 1 |
| 1915 | - | - | - | - | - | - | 1 | - | - | - | - | - | 1 |
| 1916 | - | - | - | - | - | - | - | - | - | - | - | - | - |
| 1917 | - | - | - | - | - | - | - | - | - | - | - | - | - |
| 1918 | - | - | - | - | - | - | - | - | - | - | - | - | - |
| 1919 | - | - | - | - | - | - | - | - | - | - | - | - | - |
| 1920 | - | - | - | - | - | - | - | - | - | - | - | - | - |
| 1921 | - | - | - | - | - | - | - | - | - | - | - | - | - |
| 1922 | - | - | - | - | - | - | - | - | - | - | - | - | - |
| 1923 | - | - | - | - | - | - | - | - | - | - | - | - | - |
| 1924 | - | - | - | - | - | - | - | - | 1 | - | - | - | 1 |
| 1925 | - | - | - | - | - | - | - | - | - | - | - | - | - |
| 1926 | - | - | - | - | - | - | - | - | - | - | - | - | - |
| 1927 | - | - | - | - | - | - | - | - | - | - | - | - | - |
| 1928 | - | - | - | - | - | - | - | - | - | - | - | - | - |
| 1929 | - | - | - | - | - | - | - | - | - | - | - | - | - |
| 1930 | - | - | - | - | - | - | - | - | - | - | - | - | - |
| 1931 | - | - | - | - | - | - | - | 1 | - | - | - | - | 1 |
| 1932 | - | - | - | - | - | - | - | - | - | - | - | - | - |
| 1933 | - | - | - | - | - | - | - | - | - | - | - | - | - |
| 1934 | - | - | - | - | - | - | - | - | - | - | - | - | - |
| 1935 | - | - | - | - | - | - | - | - | - | - | - | - | - |
| 1936 | - | - | - | - | - | - | - | - | - | - | - | - | - |
| 1937 | - | - | - | - | - | - | - | - | - | - | - | - | - |
| 1938 | - | - | - | - | - | 1 | 1 | - | - | - | - | - | 2 |
| 1939 | - | - | - | - | - | - | 2 | 1 | - | - | - | - | 3 |
| 1947 | - | - | - | - | - | - | - | 1 | - | - | - | - | 1 |
| 1948 | - | - | - | - | - | - | - | - | - | - | - | - | - |
| 1949 | - | - | - | - | - | - | - | - | - | - | - | - | - |
| 1950 | - | - | - | - | - | - | - | - | - | - | - | - | - |
| 1951 | - | - | - | - | - | - | - | - | - | - | - | - | - |
| 1952 | - | - | - | - | - | - | - | - | - | - | - | - | - |
| 1953 | - | - | - | - | - | - | - | 1 | - | - | - | - | 1 |
| 1954 | - | - | - | - | - | - | - | 3 | 1 | - | - | - | 4 |
| 1955 | - | - | - | - | - | - | - | - | - | - | - | - | - |
| 1956 | - | - | - | - | - | - | - | 2 | - | - | - | - | 2 |
| 1957 | - | - | - | - | - | - | - | 1 | - | - | - | - | 1 |
| 1958 | - | - | - | - | - | - | 5 | - | 1 | - | - | - | 6 |
| 1959 | - | - | - | - | - | - | - | - | - | - | - | - | - |
| 1960 | - | - | - | - | - | - | 4 | 2 | - | - | - | - | 6 |
| 1961 | - | - | - | - | - | - | 1 | - | 1 | - | - | - | 2 |
| 1962 | - | - | - | - | - | - | 2 | 3 | - | - | - | - | 5 |
| 1963 | - | - | - | - | 7 | 1 | - | 1 | 2 | - | - | - | 11 |
| 1964 | - | - | - | - | - | - | - | - | - | - | - | - | - |
| 1965 | - | - | - | - | - | - | - | - | - | - | - | - | - |
| 1966 | - | - | - | - | - | - | - | 3 | - | - | - | - | 3 |
| 1967 | - | - | - | - | 1 | - | 2 | - | - | - | - | - | 3 |
| 1968 | - | - | - | - | - | - | 3 | 1 | - | - | - | - | 4 |
| 1969 | - | - | - | - | - | - | - | - | 5 | - | - | - | 5 |
| 1970 | - | - | - | - | - | - | - | - | - | - | - | - | - |
| 1971 | - | - | - | - | - | - | - | - | - | - | - | - | - |
| 1972 | - | - | - | - | - | - | 3 | - | - | - | - | - | 3 |
| 1973 | - | - | - | - | - | - | - | - | - | - | - | - | - |
| 1974 | - | - | - | - | - | 1 | - | 3 | - | - | - | - | 4 |
| 1975 | - | - | - | - | - | - | - | - | - | - | - | - | - |
| 1976 | - | - | - | - | 1 | - | - | 2 | - | - | - | - | 3 |
| 1977 | - | - | - | - | - | - | - | 2 | - | - | - | - | 2 |
| 1978 | - | - | - | - | - | - | 2 | - | - | - | - | - | 2 |
| 1979 | - | - | - | - | - | - | - | - | - | - | - | - | - |
| 1980 | - | - | - | - | - | 4 | 2 | - | - | - | - | - | 6 |
| 1981 | - | - | - | - | - | - | - | - | - | - | - | - | - |
| 1982 | - | - | - | - | - | - | 1 | - | - | - | - | - | 1 |
| 1983 | - | - | - | - | - | - | - | - | - | - | - | - | - |
| 1984 | - | - | - | - | - | - | - | 1 | - | - | - | - | 1 |
| 1985 | - | - | - | - | - | - | - | - | - | - | - | - | - |
| 1986 | - | - | - | - | - | - | 1 | 1 | - | - | - | - | 2 |
| 1987 | - | - | - | - | - | - | 1 | - | - | - | - | - | 1 |
| 1988 | - | - | - | - | - | - | - | - | - | - | - | - | - |
| 1989 | - | - | - | - | - | - | - | 1 | 1 | - | - | - | 2 |
| 1990 | - | - | - | - | - | - | - | 2 | - | - | - | - | 2 |
| 1991 | - | - | - | - | - | 1 | 1 | - | - | - | - | - | 2 |
| 1992 | - | - | - | - | - | - | - | 2 | - | - | - | - | 2 |
| 1993 | - | - | - | - | - | - | - | - | - | - | - | - | - |
| 1994 | - | - | - | - | - | - | 2 | - | - | - | - | - | 2 |
| 1995 | - | - | - | - | 1 | - | - | - | - | - | - | - | 1 |
| 1996 | - | - | - | - | - | - | 1 | - | - | - | - | - | 1 |
| 1997 | - | - | - | - | - | - | - | - | - | - | - | - | - |
| 1998 | - | - | - | - | - | - | - | 1 | - | - | - | - | 1 |
| 1999 | - | - | - | - | - | - | - | 1 | - | - | - | - | 1 |
| 2000 | - | - | - | - | - | 1 | - | - | - | - | - | - | 1 |
| 2001 | - | - | - | - | - | - | - | 1 | - | - | - | - | 1 |
| 2002 | - | - | - | - | - | - | - | - | - | - | - | - | - |
| 2003 | - | - | - | - | - | - | - | - | - | - | - | - | - |
| 2004 | - | - | - | - | - | 1 | 1 | - | - | - | - | - | 2 |
| 2005 | - | - | - | - | - | - | 3 | - | 1 | - | - | - | 4 |
| 2006 | - | - | - | - | - | - | 1 | - | - | - | - | - | 1 |
| 2007 | - | - | - | - | - | - | 6 | 2 | - | - | - | - | 8 |
| 2008 | - | - | - | - | - | - | 1 | 2 | 2 | - | - | - | 5 |
| 2009 | - | - | - | - | - | - | 1 | 4 | 3 | - | - | - | 8 |
| 2010 | - | - | - | - | - | - | - | - | 1 | - | - | - | 1 |
| 2011 | - | - | - | - | - | 1 | - | 2 | - | - | - | - | 3 |
| 2012 | - | - | - | - | - | - | - | 3 | - | - | - | - | 3 |
| 2013 | - | - | - | - | - | 1 | - | 1 | 1 | - | - | - | 3 |
| 2014 | - | - | - | - | - | - | 1 | 5 | 1 | - | - | - | 7 |
| 2015 | - | - | - | - | - | 4 | 2 | 3 | - | - | - | - | 9 |
| 2016 | - | - | - | - | - | 7 | 5 | 1 | 1 | - | - | - | 14 |
| 2017 | - | - | - | - | - | 2 | 3 | 6 | 2 | - | - | - | 13 |
| 2018 | - | - | - | - | 9 | 2 | 2 | 1 | 1 | - | - | - | 15 |
| 2019 | - | - | - | - | - | - | 1 | 3 | |||||
| Climatological Normal (1961 - 1990) | - | - | - | - | 0.30 | 0.20 | 0.60 | 0.67 | 0.30 | - | - | - | 2.07 |
| Climatological Normal (1971 - 2000) | - | - | - | - | 0.07 | 0.23 | 0.47 | 0.53 | 0.03 | - | - | - | 1.33 |
| Climatological Normal (1981 - 2010) | - | - | - | - | 0.03 | 0.10 | 0.67 | 0.60 | 0.27 | - | - | - | 1.67 |
| Mean (1884 - 2018) | - | - | - | - | 0.15 | 0.22 | 0.49 | 0.55 | 0.22 | 0.02 | - | - | 1.65 |
| Year | Jan | Feb | Mar | Apr | May | Jun | Jul | Aug | Sep | Oct | Nov | Dec | Annual Total |
| Absolute Maximum in red colour |
| Column's Maximum in yellow background colour |