Half-monthly normals of Air Temperature and Rainfall recorded at the Hong Kong Observatory, 1991-2020
| Date | Air Temperature Figure |
Mean Total Rainfall (mm) Figure |
||
|---|---|---|---|---|
| Mean Maximum (deg.C) |
Mean (deg.C) |
Mean Minimum (deg.C) |
||
| Jan 01-15 | 19.1 | 16.9 | 15.1 | 15.3 |
| Jan 16-31 | 18.4 | 16.1 | 14.2 | 17.9 |
| Feb 01-15 | 19.1 | 16.8 | 14.9 | 21.5 |
| Feb 16-29 | 19.8 | 17.5 | 15.7 | 17.4 |
| Mar 01-15 | 20.9 | 18.5 | 16.6 | 24.9 |
| Mar 16-31 | 22.9 | 20.4 | 18.5 | 50.4 |
| Apr 01-15 | 24.4 | 21.8 | 20 | 73.1 |
| Apr 16-30 | 26.8 | 24.1 | 22.2 | 79.8 |
| May 01-15 | 28.3 | 25.7 | 23.8 | 128.4 |
| May 16-31 | 29.3 | 26.9 | 25.1 | 162.2 |
| Jun 01-15 | 30.3 | 27.9 | 26.1 | 267.5 |
| Jun 16-30 | 31.1 | 28.7 | 26.9 | 224 |
| Jul 01-15 | 31.6 | 29 | 27 | 165 |
| Jul 16-31 | 31.5 | 28.9 | 26.9 | 220.8 |
| Aug 01-15 | 31.3 | 28.8 | 26.7 | 224.5 |
| Aug 16-31 | 31.3 | 28.6 | 26.7 | 228.7 |
| Sep 01-15 | 30.8 | 28.2 | 26.3 | 183.1 |
| Sep 16-30 | 30.2 | 27.6 | 25.8 | 138.3 |
| Oct 01-15 | 28.9 | 26.5 | 24.7 | 76.6 |
| Oct 16-31 | 27.3 | 24.9 | 23.1 | 43.7 |
| Nov 01-15 | 25.5 | 23.2 | 21.3 | 21.4 |
| Nov 16-30 | 23.4 | 21.2 | 19.3 | 18 |
| Dec 01-15 | 21.2 | 19.1 | 17.2 | 14.5 |
| Dec 16-31 | 19.6 | 17.3 | 15.3 | 14.4 |
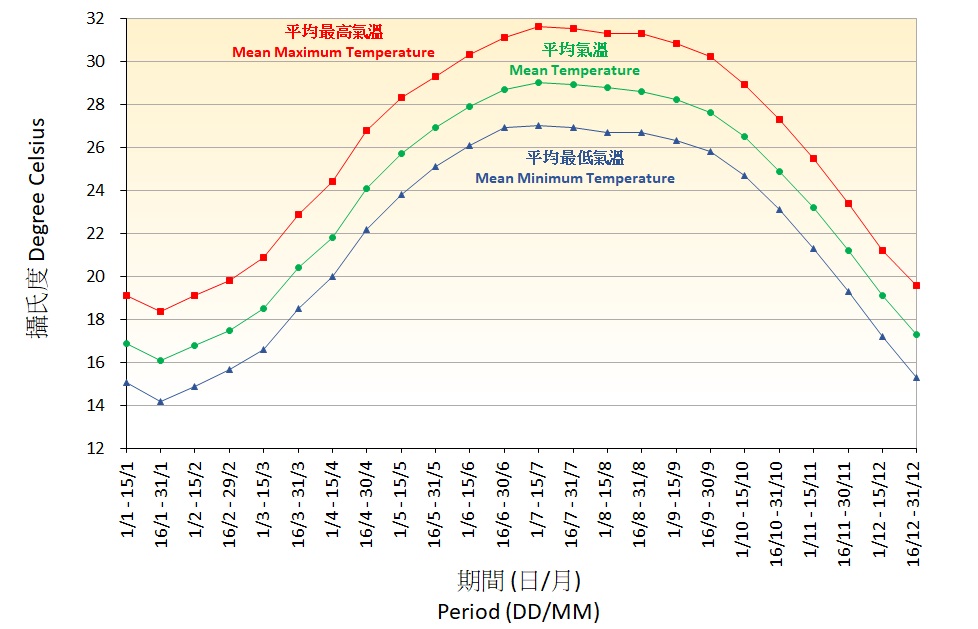
Figure 1. Half-monthly normals of Air Temperature recorded at the Hong Kong Observatory(1991-2020)
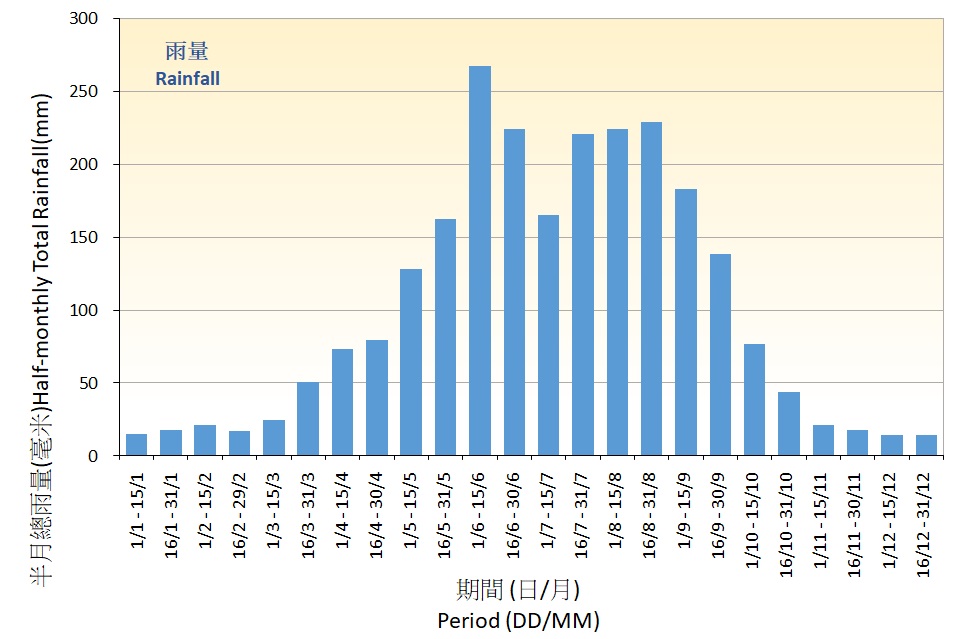
Figure 2. Half-monthly normals of Rainfall recorded at the Hong Kong Observatory (1991-2020)