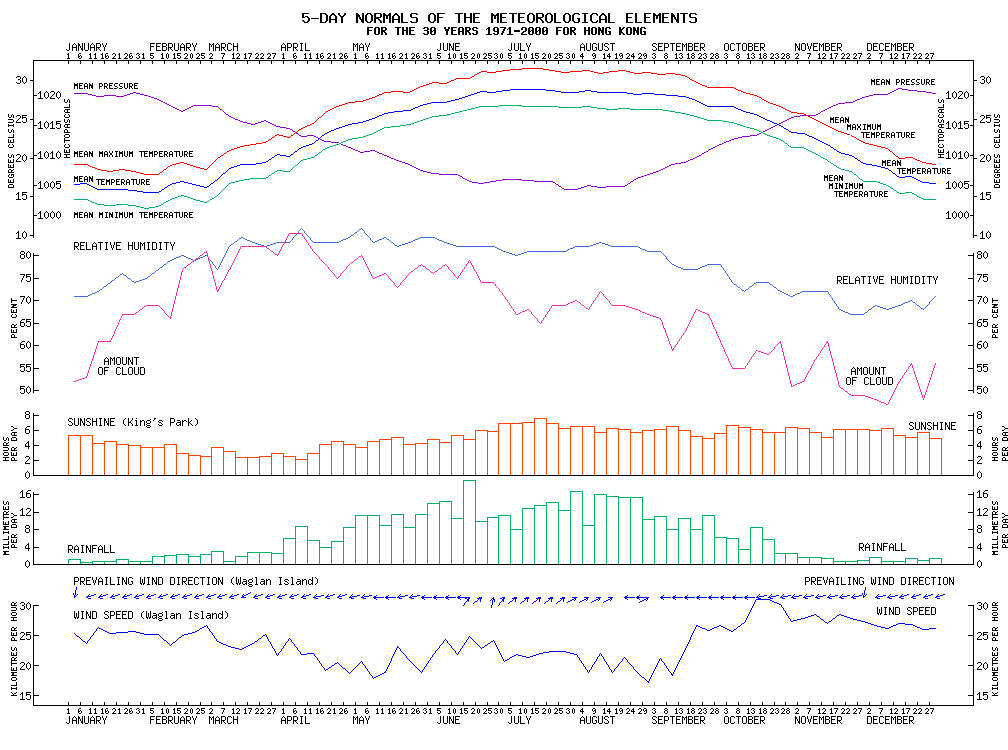
5-Day Normals of Meteorological Elements for Hong Kong, 1971-2000
View data in graph format
 Date |
Mean Pressure (hPa) Figure |
Air Temperature Figure |
Wet-Bulb Temp. (deg. C) Figure |
Dew Point Temp. (deg. C) Figure |
Relative Humidity (%) Figure |
Mean Daily Rainfall (mm) Figure |
Amount of Cloud (%) Figure |
||
|---|---|---|---|---|---|---|---|---|---|
Mean Maximum (deg. C) |
Mean (deg. C) |
Mean Minimum (deg. C) |
|||||||
| Jan 01-05 | 1020.3 | 19.2 | 16.6 | 14.6 | 13.7 | 10.9 | 71 | 1.1 | 52 |
| Jan 06-10 | 1020.3 | 19.2 | 16.7 | 14.6 | 13.8 | 11.0 | 71 | 0.5 | 53 |
| Jan 11-15 | 1019.8 | 18.5 | 16.0 | 14.0 | 13.3 | 10.7 | 72 | 0.8 | 61 |
| Jan 16-20 | 1020.0 | 18.3 | 15.9 | 13.9 | 13.4 | 11.1 | 74 | 0.6 | 61 |
| Jan 21-25 | 1019.8 | 18.5 | 16.0 | 14.0 | 13.7 | 11.6 | 76 | 1.2 | 67 |
| Jan 26-30 | 1020.5 | 18.2 | 15.8 | 13.9 | 13.3 | 11.0 | 74 | 0.6 | 67 |
| Jan 31-Feb 04 | 1020.0 | 17.9 | 15.5 | 13.5 | 13.1 | 10.8 | 75 | 0.8 | 69 |
| Feb 05-09 | 1019.4 | 17.9 | 15.5 | 13.7 | 13.3 | 11.3 | 77 | 1.9 | 69 |
| Feb 10-14 | 1018.3 | 19.0 | 16.6 | 14.6 | 14.4 | 12.6 | 79 | 2.0 | 66 |
| Feb 15-19 | 1017.4 | 19.4 | 17.0 | 15.1 | 15.0 | 13.3 | 80 | 2.3 | 77 |
| Feb 20-24 | 1018.3 | 18.9 | 16.6 | 14.7 | 14.6 | 12.7 | 79 | 1.9 | 79 |
| Feb 25-Mar 01 | 1018.4 | 18.5 | 16.2 | 14.3 | 14.2 | 12.4 | 80 | 2.2 | 81 |
| Mar 02-06 | 1018.1 | 20.0 | 17.2 | 15.2 | 14.9 | 12.8 | 77 | 2.9 | 72 |
| Mar 07-11 | 1016.5 | 21.0 | 18.6 | 16.7 | 16.6 | 15.2 | 82 | 0.8 | 77 |
| Mar 12-16 | 1015.6 | 21.5 | 19.1 | 17.1 | 17.4 | 16.2 | 84 | 1.9 | 82 |
| Mar 17-21 | 1015.2 | 21.7 | 19.2 | 17.3 | 17.4 | 16.1 | 83 | 2.7 | 82 |
| Mar 22-26 | 1015.9 | 22.0 | 19.4 | 17.4 | 17.5 | 16.2 | 82 | 2.8 | 82 |
| Mar 27-31 | 1014.9 | 23.0 | 20.4 | 18.4 | 18.5 | 17.3 | 83 | 2.5 | 80 |
| Apr 01-05 | 1014.5 | 22.6 | 20.2 | 18.3 | 18.3 | 17.0 | 83 | 5.9 | 85 |
| Apr 06-10 | 1013.1 | 23.8 | 21.4 | 19.7 | 19.8 | 18.7 | 86 | 8.8 | 85 |
| Apr 11-15 | 1013.4 | 24.5 | 21.9 | 20.1 | 20.0 | 18.7 | 83 | 5.5 | 81 |
| Apr 16-20 | 1012.4 | 25.9 | 23.1 | 21.2 | 21.1 | 19.9 | 83 | 3.9 | 78 |
| Apr 21-25 | 1012.1 | 26.7 | 23.8 | 21.8 | 21.7 | 20.5 | 83 | 5.2 | 75 |
| Apr 26-30 | 1011.4 | 27.1 | 24.3 | 22.4 | 22.4 | 21.4 | 84 | 8.4 | 78 |
| May 01-05 | 1010.5 | 27.3 | 24.6 | 22.7 | 22.8 | 21.9 | 86 | 11.2 | 80 |
| May 06-10 | 1010.8 | 27.8 | 25.1 | 23.2 | 23.0 | 21.9 | 83 | 11.3 | 75 |
| May 11-15 | 1010.0 | 28.5 | 25.8 | 24.0 | 23.7 | 22.8 | 84 | 9.0 | 76 |
| May 16-20 | 1009.1 | 28.6 | 26.0 | 24.1 | 23.7 | 22.6 | 82 | 11.4 | 73 |
| May 21-25 | 1008.5 | 28.5 | 26.1 | 24.3 | 23.9 | 22.9 | 83 | 8.4 | 76 |
| May 26-30 | 1007.5 | 29.2 | 26.8 | 24.9 | 24.7 | 23.7 | 84 | 11.5 | 78 |
| May 31-Jun 04 | 1007.0 | 29.7 | 27.2 | 25.3 | 25.0 | 24.1 | 84 | 13.9 | 76 |
| Jun 05-09 | 1006.8 | 29.6 | 27.2 | 25.5 | 25.0 | 24.0 | 83 | 14.5 | 78 |
| Jun 10-14 | 1006.9 | 30.2 | 27.6 | 25.9 | 25.3 | 24.2 | 82 | 10.6 | 75 |
| Jun 15-19 | 1005.7 | 30.3 | 28.1 | 26.3 | 25.7 | 24.7 | 82 | 19.3 | 79 |
| Jun 20-24 | 1005.4 | 31.1 | 28.6 | 26.7 | 26.2 | 25.2 | 82 | 9.8 | 74 |
| Jun 25-29 | 1005.6 | 31.0 | 28.5 | 26.6 | 26.1 | 25.0 | 82 | 10.8 | 74 |
| Jun 30-Jul 04 | 1006.0 | 31.3 | 28.7 | 26.8 | 26.2 | 25.1 | 81 | 11.1 | 71 |
| Jul 05-09 | 1006.0 | 31.4 | 28.8 | 26.8 | 26.1 | 25.0 | 80 | 7.9 | 67 |
| Jul 10-14 | 1005.9 | 31.5 | 28.8 | 26.6 | 26.1 | 25.0 | 81 | 12.9 | 68 |
| Jul 15-19 | 1005.7 | 31.5 | 28.8 | 26.7 | 26.1 | 25.0 | 81 | 13.4 | 65 |
| Jul 20-24 | 1005.7 | 31.3 | 28.7 | 26.7 | 26.2 | 25.1 | 81 | 14.1 | 69 |
| Jul 25-29 | 1004.3 | 31.0 | 28.5 | 26.5 | 25.9 | 24.9 | 81 | 12.3 | 69 |
| Jul 30-Aug 03 | 1004.3 | 31.2 | 28.5 | 26.5 | 26.0 | 25.0 | 82 | 16.8 | 70 |
| Aug 04-08 | 1005.0 | 31.3 | 28.7 | 26.6 | 26.2 | 25.1 | 82 | 9.0 | 68 |
| Aug 09-13 | 1004.6 | 30.9 | 28.4 | 26.4 | 26.1 | 25.1 | 83 | 16.1 | 72 |
| Aug 14-18 | 1004.9 | 31.2 | 28.4 | 26.2 | 25.9 | 24.9 | 82 | 15.5 | 69 |
| Aug 19-23 | 1004.9 | 31.3 | 28.5 | 26.4 | 25.9 | 24.9 | 82 | 15.4 | 69 |
| Aug 24-28 | 1006.1 | 30.9 | 28.2 | 26.2 | 25.7 | 24.6 | 82 | 15.4 | 68 |
| Aug 29-Sep 02 | 1006.8 | 31.0 | 28.3 | 26.3 | 25.7 | 24.6 | 81 | 10.3 | 67 |
| Sep 03-07 | 1007.5 | 30.8 | 28.2 | 26.2 | 25.7 | 24.6 | 81 | 11.0 | 66 |
| Sep 08-12 | 1008.5 | 30.9 | 28.1 | 26.0 | 25.1 | 23.8 | 78 | 7.9 | 59 |
| Sep 13-17 | 1008.9 | 30.6 | 27.9 | 25.8 | 24.8 | 23.3 | 77 | 10.5 | 63 |
| Sep 18-22 | 1009.6 | 29.8 | 27.4 | 25.3 | 24.2 | 22.7 | 77 | 7.9 | 68 |
| Sep 23-27 | 1010.9 | 29.1 | 26.7 | 24.9 | 23.9 | 22.5 | 78 | 11.2 | 67 |
| Sep 28-Oct 02 | 1011.8 | 29.1 | 26.6 | 24.8 | 23.7 | 22.3 | 78 | 6.2 | 61 |
| Oct 03-07 | 1012.7 | 29.1 | 26.6 | 24.6 | 23.2 | 21.5 | 74 | 5.9 | 55 |
| Oct 08-12 | 1013.1 | 28.5 | 26.0 | 24.1 | 22.4 | 20.5 | 72 | 3.4 | 55 |
| Oct 13-17 | 1013.4 | 28.1 | 25.6 | 23.7 | 22.2 | 20.4 | 74 | 8.4 | 59 |
| Oct 18-22 | 1014.4 | 27.2 | 24.8 | 22.9 | 21.5 | 19.7 | 74 | 5.8 | 58 |
| Oct 23-27 | 1015.3 | 26.7 | 24.2 | 22.4 | 20.8 | 18.8 | 72 | 2.5 | 61 |
| Oct 28-Nov 01 | 1016.3 | 25.9 | 23.3 | 21.3 | 19.7 | 17.4 | 71 | 2.6 | 51 |
| Nov 02-06 | 1016.7 | 25.7 | 23.2 | 21.3 | 19.8 | 17.6 | 72 | 1.7 | 52 |
| Nov 07-11 | 1016.6 | 25.0 | 22.5 | 20.6 | 19.2 | 17.0 | 72 | 1.5 | 57 |
| Nov 12-16 | 1017.9 | 24.2 | 21.7 | 19.7 | 18.4 | 16.0 | 72 | 1.4 | 61 |
| Nov 17-21 | 1018.7 | 23.4 | 20.7 | 18.6 | 17.2 | 14.4 | 68 | 0.8 | 51 |
| Nov 22-26 | 1018.9 | 22.9 | 20.3 | 18.2 | 16.5 | 13.4 | 67 | 0.8 | 49 |
| Nov 27-Dec 01 | 1019.7 | 22.0 | 19.3 | 17.0 | 15.6 | 12.4 | 67 | 0.9 | 49 |
| Dec 02-06 | 1020.1 | 21.6 | 19.0 | 17.0 | 15.7 | 12.9 | 69 | 1.6 | 48 |
| Dec 07-11 | 1020.1 | 21.2 | 18.6 | 16.5 | 15.2 | 12.2 | 68 | 0.7 | 47 |
| Dec 12-16 | 1021.2 | 20.0 | 17.5 | 15.4 | 14.2 | 11.3 | 69 | 0.8 | 52 |
| Dec 17-21 | 1020.8 | 20.1 | 17.6 | 15.5 | 14.5 | 11.7 | 70 | 1.3 | 56 |
| Dec 22-26 | 1020.7 | 19.4 | 16.8 | 14.6 | 13.6 | 10.3 | 68 | 1.0 | 48 |
| Dec 27-31 | 1020.4 | 19.2 | 16.7 | 14.7 | 13.9 | 11.0 | 71 | 1.4 | 56 |
| Observed at | Hong Kong Observatory | ||||||||
Date |
Mean Daily Sunshine (hours) Figure |
Wind Figure |
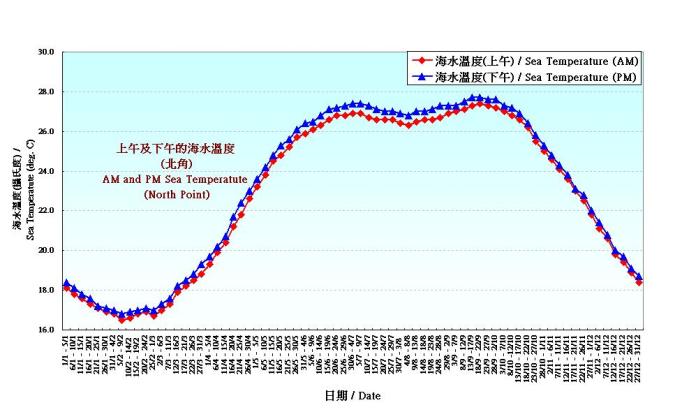
Sea Temperature Figure |
||
|---|---|---|---|---|---|
Prevailing Direction (degrees) |
Mean Speed (km/h) |
AM (deg. C) |
PM (deg. C) |
||
| Jan 01-05 | 5.3 | 010 | 25.3 |
18.1
|
18.4
|
| Jan 06-10 | 5.4 | 070 | 23.7 |
17.8
|
18.1
|
| Jan 11-15 | 4.3 | 070 | 26.4 |
17.6
|
17.8
|
| Jan 16-20 | 4.6 | 070 | 25.3 |
17.3
|
17.6
|
| Jan 21-25 | 4.1 | 070 | 25.5 |
17.1
|
17.2
|
| Jan 26-30 | 4.0 | 070 | 25.6 |
16.9
|
17.1
|
| Jan 31-Feb 04 | 3.8 | 070 | 25.2 |
16.8
|
17.0
|
| Feb 05-09 | 3.8 | 070 | 25.2 |
16.5
|
16.8
|
| Feb 10-14 | 4.2 | 070 | 23.4 |
16.6
|
16.9
|
| Feb 15-19 | 3.0 | 070 | 25.0 |
16.8
|
17.0
|
| Feb 20-24 | 2.7 | 070 | 25.5 |
16.9
|
17.1
|
| Feb 25-Mar 01 | 2.5 | 070 | 26.7 |
16.7
|
17.0
|
| Mar 02-06 | 3.8 | 070 | 24.0 |
17.0
|
17.3
|
| Mar 07-11 | 3.2 | 070 | 23.1 |
17.3
|
17.6
|
| Mar 12-16 | 2.4 | 060 | 22.6 |
17.9
|
18.2
|
| Mar 17-21 | 2.4 | 070 | 23.6 |
18.2
|
18.5
|
| Mar 22-26 | 2.6 | 070 | 25.2 |
18.5
|
18.8
|
| Mar 27-31 | 3.0 | 070 | 21.6 |
18.8
|
19.3
|
| Apr 01-05 | 2.5 | 070 | 24.5 |
19.3
|
19.7
|
| Apr 06-10 | 2.1 | 070 | 21.9 |
19.9
|
20.2
|
| Apr 11-15 | 2.9 | 080 | 22.0 |
20.4
|
20.7
|
| Apr 16-20 | 4.1 | 070 | 19.2 |
21.2
|
21.7
|
| Apr 21-25 | 4.6 | 070 | 20.5 |
21.8
|
22.4
|
| Apr 26-30 | 4.1 | 080 | 18.7 |
22.6
|
23.0
|
| May 01-05 | 3.7 | 080 | 20.7 |
23.2
|
23.6
|
| May 06-10 | 4.6 | 090 | 17.8 |
23.8
|
24.2
|
| May 11-15 | 4.8 | 090 | 18.9 |
24.5
|
24.8
|
| May 16-20 | 5.1 | 080 | 23.2 |
24.8
|
25.3
|
| May 21-25 | 4.1 | 080 | 20.8 |
25.2
|
25.6
|
| May 26-30 | 4.3 | 090 | 18.9 |
25.7
|
26.1
|
| May 31-Jun 04 | 4.8 | 090 | 21.8 |
25.9
|
26.4
|
| Jun 05-09 | 4.4 | 090 | 24.3 |
26.1
|
26.5
|
| Jun 10-14 | 5.4 | 090 | 21.9 |
26.3
|
26.8
|
| Jun 15-19 | 4.8 | 220 | 24.8 |
26.6
|
27.1
|
| Jun 20-24 | 6.0 | 230 | 22.9 |
26.8
|
27.2
|
| Jun 25-29 | 5.9 | 190 | 24.2 |
26.8
|
27.3
|
| Jun 30-Jul 04 | 6.9 | 220 | 20.6 |
26.9
|
27.4
|
| Jul 05-09 | 6.9 | 230 | 21.8 |
26.9
|
27.4
|
| Jul 10-14 | 7.1 | 230 | 21.3 |
26.7
|
27.3
|
| Jul 15-19 | 7.6 | 230 | 22.0 |
26.6
|
27.1
|
| Jul 20-24 | 7.0 | 230 | 22.3 |
26.6
|
27.0
|
| Jul 25-29 | 6.3 | 230 | 22.3 |
26.6
|
27.0
|
| Jul 30-Aug 03 | 6.5 | 240 | 21.9 |
26.4
|
26.9
|
| Aug 04-08 | 6.6 | 240 | 18.9 |
26.3
|
26.8
|
| Aug 09-13 | 5.8 | 240 | 22.0 |
26.5
|
27.0
|
| Aug 14-18 | 6.3 | 240 | 18.9 |
26.6
|
27.0
|
| Aug 19-23 | 6.2 | 090 | 21.3 |
26.6
|
27.1
|
| Aug 24-28 | 5.8 | 090 | 19.0 |
26.7
|
27.3
|
| Aug 29-Sep 02 | 6.0 | 240 | 17.1 |
26.9
|
27.3
|
| Sep 03-07 | 6.2 | 090 | 21.1 |
27.0
|
27.3
|
| Sep 08-12 | 6.6 | 090 | 18.3 |
27.1
|
27.5
|
| Sep 13-17 | 6.0 | 090 | 22.3 |
27.3
|
27.7
|
| Sep 18-22 | 5.2 | 090 | 26.7 |
27.4
|
27.7
|
| Sep 23-27 | 5.0 | 090 | 25.9 |
27.3
|
27.6
|
| Sep 28-Oct 02 | 5.6 | 090 | 26.7 |
27.2
|
27.6
|
| Oct 03-07 | 6.7 | 090 | 25.6 |
27.0
|
27.3
|
| Oct 08-12 | 6.4 | 090 | 27.1 |
26.8
|
27.2
|
| Oct 13-17 | 6.1 | 080 | 31.0 |
26.6
|
26.9
|
| Oct 18-22 | 5.8 | 080 | 31.0 |
26.2
|
26.4
|
| Oct 23-27 | 5.7 | 080 | 30.2 |
25.5
|
25.8
|
| Oct 28-Nov 01 | 6.4 | 080 | 27.4 |
25.0
|
25.3
|
| Nov 02-06 | 6.3 | 080 | 27.9 |
24.6
|
24.8
|
| Nov 07-11 | 5.8 | 080 | 28.5 |
24.1
|
24.3
|
| Nov 12-16 | 5.1 | 080 | 27.0 |
23.6
|
23.8
|
| Nov 17-21 | 6.2 | 080 | 28.5 |
23.0
|
23.1
|
| Nov 22-26 | 6.1 | 080 | 27.8 |
22.5
|
22.8
|
| Nov 27-Dec 01 | 6.1 | 010 | 27.4 |
21.8
|
22.0
|
| Dec 02-06 | 6.0 | 080 | 26.6 |
21.1
|
21.4
|
| Dec 07-11 | 6.3 | 080 | 26.1 |
20.6
|
20.8
|
| Dec 12-16 | 5.3 | 070 | 27.0 |
19.8
|
20.0
|
| Dec 17-21 | 5.1 | 070 | 26.8 |
19.4
|
19.7
|
| Dec 22-26 | 5.7 | 070 | 26.0 |
18.9
|
19.1
|
| Dec 27-31 | 5.0 | 070 | 26.1 |
18.4
|
18.7
|
| Observed at | King's Park | Waglan Island | North Point | ||
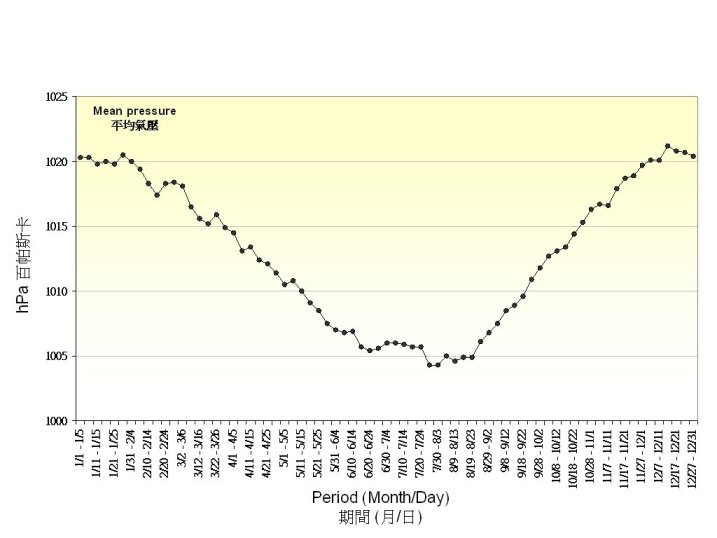
Figure 1. 5-Day normals of Mean Sea Level Pressure recorded at the Hong Kong Observatory (1971-2000)
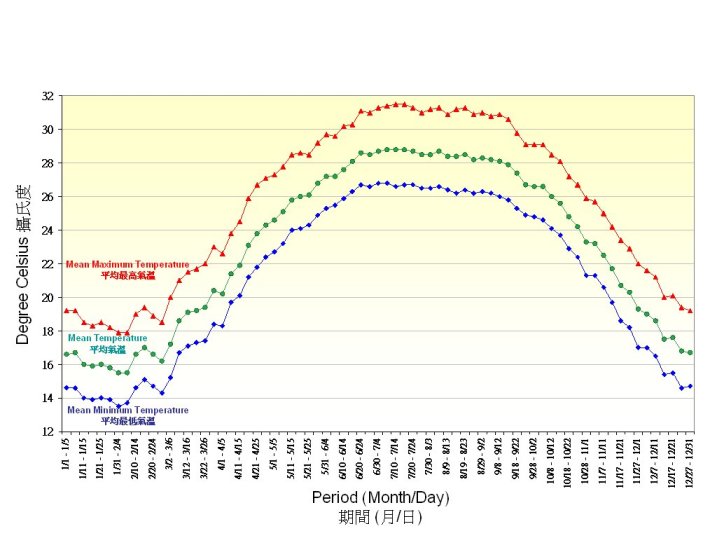
Figure 2. 5-Day normals of Air Temperature recorded at the Hong Kong Observatory (1971-2000)
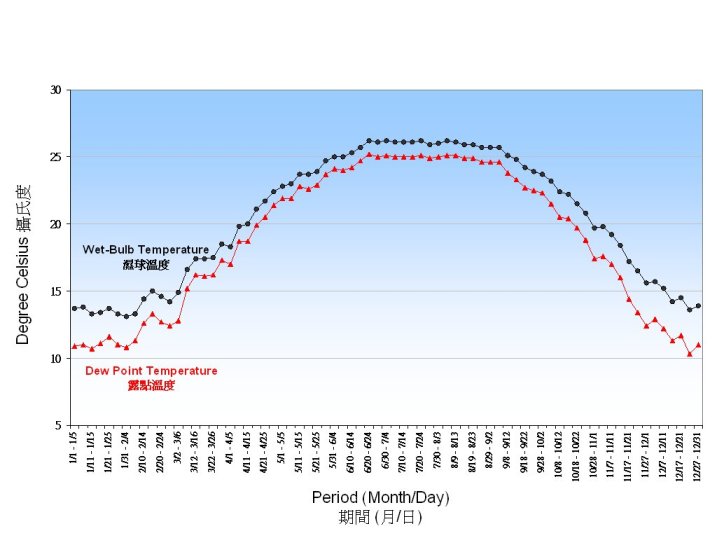
Figure 3. 5-Day normals of Wet-bulb and Dew-point Temperature recorded at the Hong Kong Observatory (1971-2000)
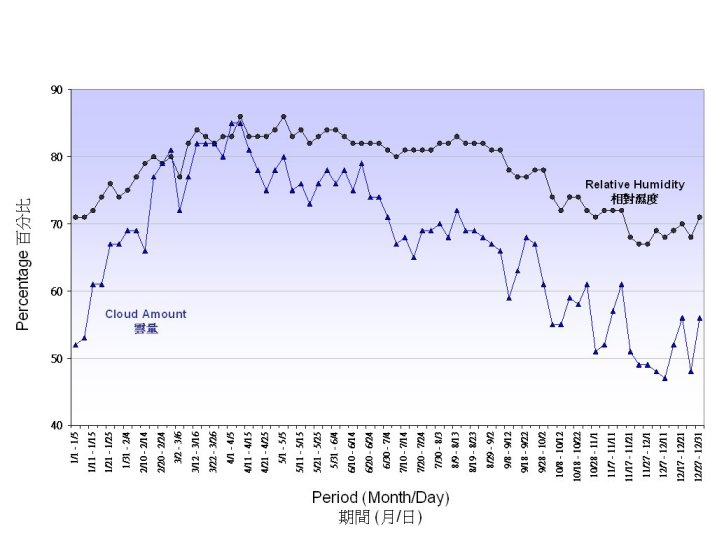
Figure 4. 5-Day normals of Relative Humdity and cloud amount recorded at the Hong Kong Observatory (1971-2000)
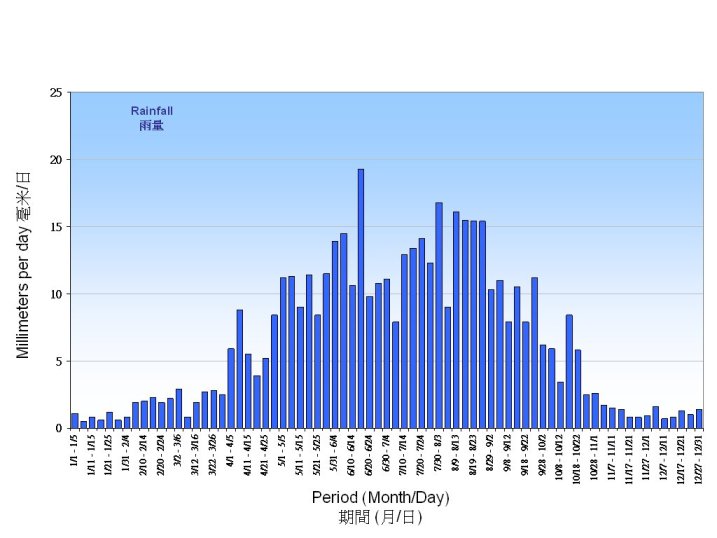
Figure 5. 5-Day normals of daily mean rainfall recorded at the Hong Kong Observatory (1971-2000)
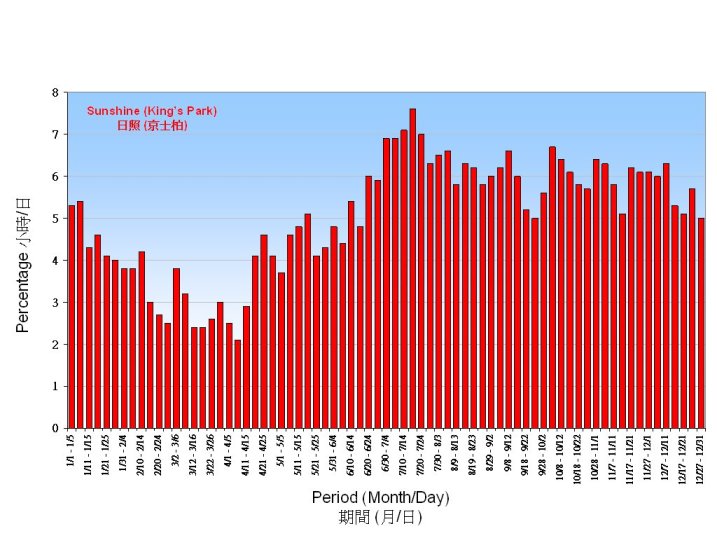
Figure 6. 5-Day normals of Mean Daily Sunshine recorded at King'sPark (1971-2000)
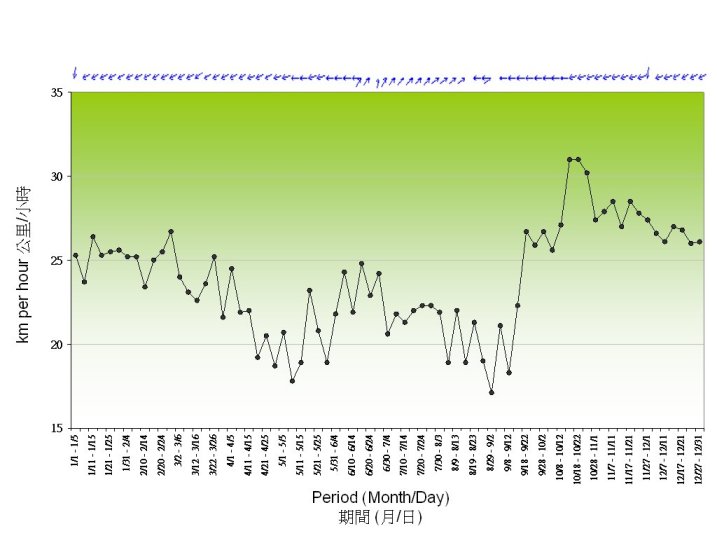
Figure 7. 5-Day normals of wind recorded at the Waglan Island (1971-2000)
Figure 8. 5-Day normals of sea temperature recorded at the North Point (1975-2004)