Greenhouse Effect
What is Greenhouse Effect ?

|
The Greenhouse Effect is a term that refers to a physical property of the Earth's atmosphere. If the Earth had no atmosphere, its average surface temperature would be very low of about -18 rather than the comfortable 15 found today. The difference in temperature is due to a suite of gases called greenhouse gases which affect the overall energy balance of the Earth's system by absorbing infra-red radiation. In its existing state, the Earth-atmosphere system balances absorption of solar radiation by emission of infrared radiation to space (Fig. 1). Due to greenhouse gases, the atmosphere absorbs more infrared energy than it re-radiates to space, resulting in a net warming of the Earth-atmosphere system and of surface temperature. This is the Natural Greenhouse Effect. With more greenhouse gases released to the atmosphere due to human activity, more infrared radiation will be trapped in the Earth's surface which contributes to the Enhanced Greenhouse Effect. |
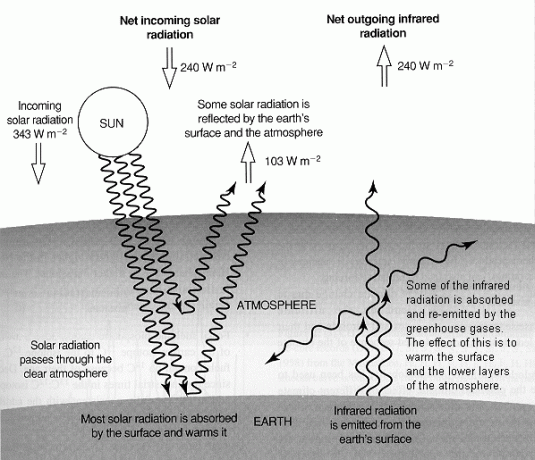
Fig. 1 A simplified diagram illustrating the global long-term radiative balance of the atmosphere. Net input of solar radiation (240 Wm-2) must be balanced by net output of infrared radiation. About a third (103 Wm-2) of incoming solar radiation is reflected and the remainder is mostly absorbed by the surface. Outgoing infrared radiation is absorbed by greenhouse gases and by clouds keeping the surface about 33 warmer than it would otherwise be.
Types of Greenhouse gases
Greenhouse gases comprise less than 1% of the atmosphere. Their levels are determined by a balance between sources and sinks. Sources and sinks are processes that generate and destroy greenhouse gases respectively. Human affect greenhouse gas levels by introducing new sources or by interfering with natural sinks.
The major greenhouse gases in the atmosphere are carbon dioxide (CO2), methane, (CH4), nitrous oxide (N2O), chlorofluorocarbons (CFCs) and ozone (O3). Atmospheric water vapour (H2O) also makes a large contribution to the natural greenhouse effect but it is thought that its presence is not directly affected by human activity. Characteristics of some of the greenhouse gases are shown in Table 1.
Global Warming Potential (GWP)
Different greenhouse gases exert different effects on the Earth's energy balance. In order to assist policymakers to measure the impact of various greenhouse gases on global warming, the concept of Global Warming Potentials (GWPs) was introduced by the Intergovernmental Panel on Climate Change (IPCC) in its 1990 report. GWP reflects the relative strength of individual greenhouse gas with respect to its impact on global warming. It was defined as the cumulative radiative forcing* between the present and some future time caused by a unit mass of greenhouse gas emitted now, expressed relative to CO2. The GWPs developed by IPCC for a number of greenhouse gases are shown in Table 2.
Global Warming Potentials take into account the differing atmospheric lifetimes and abilities of various gases to absorb radiation. Derivations of GWPs requires knowledge of the fate of the emitted gas (typically not well understood) and the radiative forcing due to the amount remaining in the atmosphere (reasonably well understood). Hence, GWPs encompass certain uncertainty, typically + 35% relative to CO2 reference.
* Radiative forcing is defined as a change in average net radiation at the top of the troposphere (tropopause) due to a change in either solar or infrared radiation. A radiative forcing perturbs the balance between incoming and outgoing radiation. A positive radiative forcing tends on average to warm the Earth's surface; a negative radiative forcing tends on average to cool the Earth's surface.
Trends in greenhouse gas concentrations
a) Carbon Dioxide (CO2)
High-quality observations of the concentration of CO2 began in 1958, with flask measurements at the Mauna Loa Observatory in Hawaii. Fig. 2 shows that the average annual concentration of CO2 in the atmosphere has risen from about 315 ppmv (part per million by volume) in 1958 to around 363 ppmv in 1997. There is a clear annual cycle in the Mauna Loa data that corresponds to the annual cycle of plant respiration in the Northern Hemisphere : CO2 concentration increase during the Fall and Winter and decline during Spring and Summer. This cycle, follows the growth and die back of vegetation, is reversed and of smaller amplitude in the Southern Hemisphere, and disappears almost entirely in the data measured near the Equator.
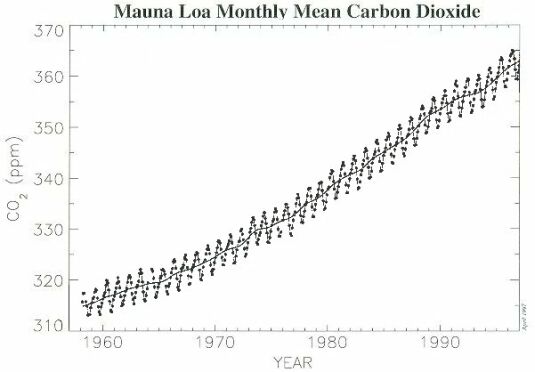
@ Fig. 2 Atmospheric carbon dioxide monthly mean mixing ratios. Data prior to May 1974 are from the Scripps Institution of Oceanography ( ), data since May 1974 are from the U.S. National Oceanic and Atmospheric Administration ( ). A long term trend curve ( ) is fitted to the monthly mean values.
b) Methane (CH4)
The rate of increase of the atmospheric abundance of methane has declined over the last decade, slowing dramatically in 1991 to 1992, though with an apparent increase in the growth rate in late 1993 (Fig. 3). The average trend over 1980 to 1990 is about 13 ppbv/year (part per billion by volume/year).
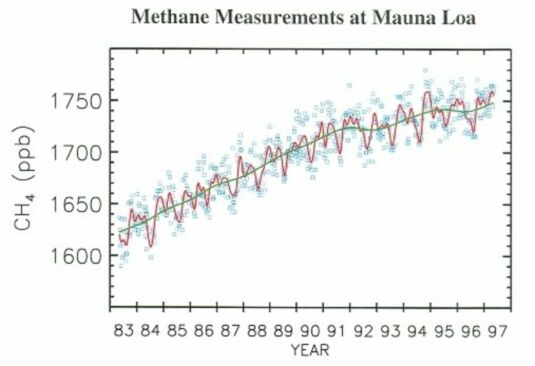
@ Fig. 3 Atmospheric methane mixing ratios from discrete air samples collected at Mauna Loa, Hawaii. A smooth curve (red) and long term trend (green) are fitted to the measurements (blue).
c) Nitrous Oxide (N2O)
Over the last four decades, the average growth rate of N2O is about 0.25%/year (Fig. 4). Current tropospheric concentration of N2O is around 312 to 314 ppbv.
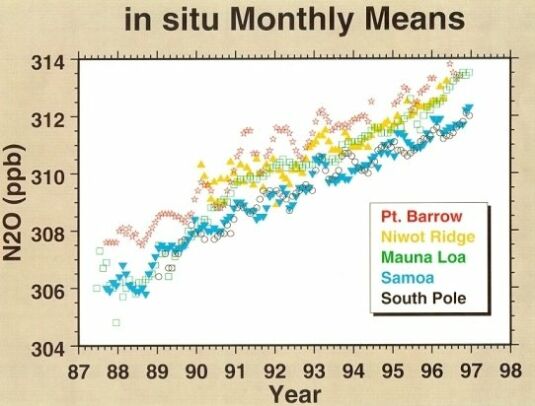
@ Fig. 4 Atmospheric N2O mixing ratios.
d) Chlorofluorocarbons (CFCs)
Among the family compounds of chlorocarbons, CFCl3 (CFC-11) and CF2Cl2 (CFC-12) are receiving more attention because of their larger concentrations and potentially significant effects on stratospheric ozone. CFC-11 and CFC-12 have the highest concentrations of the man-made chlorocarbons, around 0.27 and 0.55 ppbv, respectively (measured at Mauna Loa in 1997, Fig. 5 & 6). As indicated in their GWP values, these two gases are strong infrared absorbers. It is thought that CFC-11 and CFC-12 have contributed about one-third of the radiative forcing of gases other than CO2 during the 1980s.
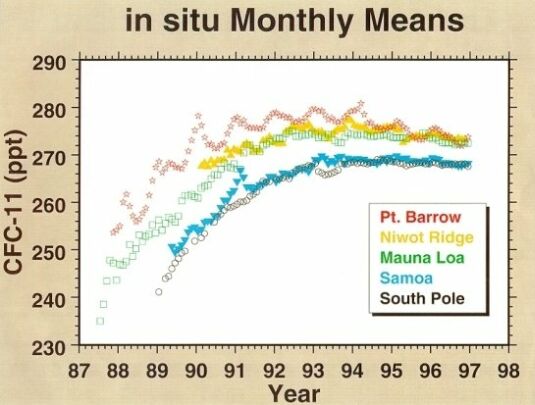
@ Fig. 5 Atmospheric CFC-11 mixing ratio.
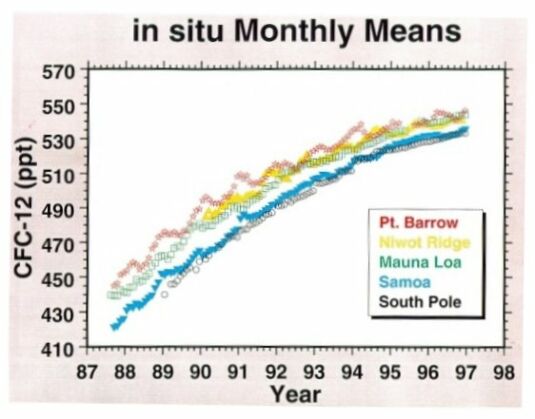
@ Fig. 6 Atmospheric CFC-12 mixing ratios.
@ ( Courtesy: Mauna Loa Observatory, Hawaii)
Consequences of Enhanced Greenhouse Effect
i) Global Warming

|
Increase of greenhouse gases concentration causes a reduction in outgoing infrared radiation, thus the Earth's climate must change somehow to restore the balance between incoming and outgoing radiation. This climatic change will include a global warming of the Earth's surface and the lower atmosphere as warming up is the simplest way for the climate to get rid of the extra energy. However, a small rise in temperature will induce many other changes, for example, cloud cover and wind patterns. Some of these changes may act to enhance the warming (positive feedbacks), others to counteract it (negative feedbacks). Using complex climate models, the "Intergovernmental Panel on Climate Change" in their third assessment report has forecast that global mean surface temperature will rise by 1.4 to 5.8 by the end of 2100. This projection takes into account the effects of aerosols which tend to cool the climate as well as the delaying effects of the oceans which have a large thermal capacity. However, there are many uncertainties associated with this projection such as future emission rates of greenhouse gases, climate feedbacks, and the size of the ocean delay ...etc. |
ii) Sea Level Rise

|
If global warming takes place, sea level will rise due to two different processes. Firstly, warmer temperature cause sea level to rise due to the thermal expansion of seawater. Secondly, water from melting glaciers and the ice sheets of Greenland and the Antarctica would also add water to the ocean. It is predicted that the Earth's average sea level will rise by 0.09 to 0.88 m between 1990 and 2100. |
Potential Impact on human life
a) Economic Impact
Over half of the human population lives within 100 kilometres of the sea. Most of this population lives in urban areas that serve as seaports. A measurable rise in sea level will have a severe economic impact on low-lying coastal areas and islands, for examples, increasing the beach erosion rates along coastlines, rising sea level displacing fresh groundwater for a substantial distance inland.
b) Agricultural Impact
Experiments have shown that with higher concentrations of CO2, plants can grow bigger and faster. However, the effect of global warming may affect the atmospheric general circulation and thus altering the global precipitation pattern as well as changing the soil moisture contents over various continents. Since it is unclear how global warming will affect climate on a regional or local scale, the probable effects on the biosphere remains uncertain.
c) Effects on Aquatic systems
The loss of coastal wetlands could certainly reduce fish populations, especially shellfish. Increased salinity in estuaries could reduce the abundance of freshwater species but could increase the presence of marine species. However, the full impact on marine species is not known.
d) Effects on Hydrological Cycle
Global precipitation is likely to increase. However, it is not known how regional rainfall patterns will change. Some regions may have more rainfall, while others may have less. Furthermore, higher temperatures would probably increase evaporation. These changes would probably create new stresses for many water management systems.
Table 1
Characteristics of some major greenhouse gases
|
Greenhouse gas |
Sources |
Sinks |
Importance for climate |
|---|---|---|---|
|
Carbon Dioxide (CO2) |
1) Burning of fossil fuel 2) Land-use change (deforestation) |
1) Ocean Uptake 2) Plants photosynthesis |
Absorbs infrared radiation; affects stratospheric O3 |
|
Methane (CH4) |
1) Biomass burning 2) Enteric fermentation 3)Rice paddies |
1) Reactions with OH 2) Microorganisms uptake by soils |
Absorbs infrared radiation; affects tropospheric O3 and OH; affects stratospheric O3 and H2O; produces CO2 |
|
Nitrous Oxide (N2O) |
1) Biomass burning 2) Fossil-fuel combustion 3) Fertilizers |
1) Removal by soils 2) Stratospheric photolysis and reaction with O |
Absorbs infrared radiation; affects stratospheric O3 |
|
Ozone (O3) |
Photochemical reactions involving O2 |
Catalytic chemical reactions involving NOx, ClOx and HOx species. |
Absorbs ultraviolet and infrared radiation |
|
Carbon Monoxide (CO) |
1) Plant emissions 2) Man-made release (transport, industrial) |
1) Soil uptake 2) Reactions with OH |
Affects stratospheric O3 and OH cycles; produces CO2 |
|
Chlorofluorocarbons (CFCs) |
Industrial production |
Insignificant in troposphere, dissociated in stratosphere (photolysis and reaction with O) |
Absorbs infrared radiation; affects stratospheric O3 |
|
Sulphur Dioxide (SO2) |
1) Volcanoes 2) Coal and Biomass burning |
1) Dry and wet deposition 2) Reactions with OH |
Forms aerosols, which scatter solar radiation |
Table 2
Global Warming Potentials (GWPs) following the instantaneous injection of 1 Kg of each Greenhouse gas, relative to 1 Kg of CO2
(Based on Intergovernmental Panel on Climate Change Third Assessment Report, 2001)
|
Greenhouse gas |
Estimated Lifetime (years) |
Global Warming Potential |
|||
|
20 years |
100 years |
500 years |
|||
|
Carbon Dioxide (CO2) |
Variable |
1 |
1 |
1 |
|
|
Methane (CH4) |
12.0 |
62 |
23 |
7 |
|
|
Nitrous Oxide (N2O) |
114 |
275 |
296 |
156 |
|
|
Chlorofluorocarbons (CFCs) |
-- |
-- |
-- |
-- |
|
|
i) |
CFCl3 (CFC-11) |
45 |
6300 |
4600 |
1600 |
|
ii) |
CF2Cl2 (CFC-12) |
100 |
10200 |
10600 |
5200 |
|
iii) |
CClF3 (CFC-13) |
640 |
10000 |
14000 |
16300 |
|
iv) |
C2F3Cl3 (CFC-113) |
85 |
6100 |
6000 |
2700 |
|
v) |
C2F4Cl2 (CFC-114) |
300 |
7500 |
9800 |
8700 |
|
vi) |
C2F5Cl (CFC-115) |
1700 |
4900 |
7200 |
9900 |