Seasonal Rainfall under El Niño
13 January 2016
The current El Niño event started in May 2014 and persisted for more than 18 months, the longest since 1950 and the strongest since 1997/98.
We pointed out earlier that El Niño's impact on the climate of Hong Kong was mainly manifested in more abundant winter and spring rainfall compared to the ENSO-neutral state[1], with tropical cyclone seasons starting no earlier than June (blog: Anticipated Return of El Niño). The rainfall amounts recorded in winter (Dec - Feb) 2014/15 and spring (Mar - May) 2015 were 118 and 606 mm respectively, both higher than the corresponding average seasonal rainfall under the ENSO-neutral state (Figure 1). The tropical cyclone season of 2015 started in June (Tropical Storm Kujira). All these observations were consistent with the statistical results.
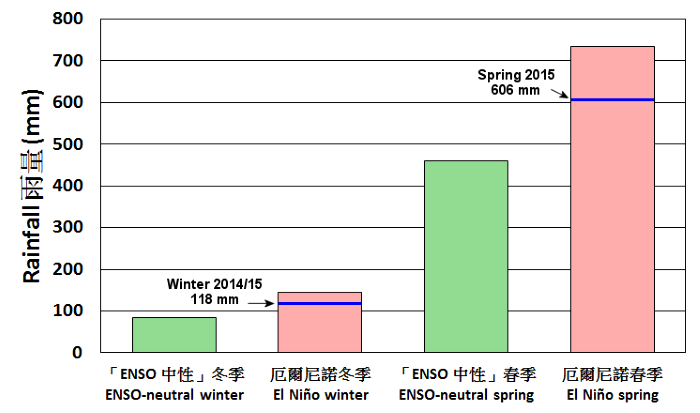
Figure 1Winter (Dec-Feb) and spring (Mar-May) rainfall of Hong Kong under the ENSO-neutral state (green)
and El Niño (pink) during 1950-2015.
For the winter of 2015/16, the rainfall recorded at the Observatory up to early January 2016 already exceeded 120 mm. With the normal range of winter rainfall lying between 64 and 147 mm, therefore it is certain that this winter will end up with normal to above-normal rainfall, a trend again consistent with the tendency of relatively wet winters under El Niño.
In the aforementioned blog, we also pointed out that El Niño would not necessarily give rise to rainy summers in Hong Kong. In fact, the chance of above-normal rainfall was noticeably lower in El Niño summers than ENSO-neutral summers (Figure 2), as was the case in 2015 with the registered summer (Jun - Aug) rainfall of 852 mm falling into the "below-normal" category[2].
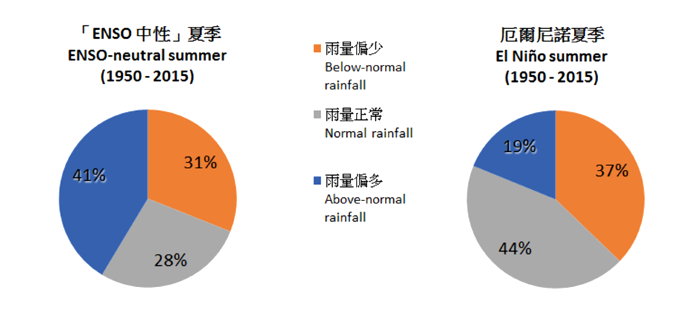
Figure 2Distribution of Hong Kong summer rainfall categories under the ENSO-neutral state (left)
and El Niño (right) during 1950-2015.
F C Sham
Notes:
[1] The ENSO-neutral state refers to the situation with neither an El Niño nor a La Niña in place, i.e. no warm (El Niño) or cold (La Niña) sea surface temperature anomalies in the central and eastern equatorial Pacific.
[2] Categorization of rainfall is based on the normal distribution constructed from climatological data in the previous 30 years. The categories are defined in such a way that the highest 30% and lowest 30% of the normal distribution are classified as "above-normal" and "below-normal" respectively, while the middle 40% represents the "normal" range.
We pointed out earlier that El Niño's impact on the climate of Hong Kong was mainly manifested in more abundant winter and spring rainfall compared to the ENSO-neutral state[1], with tropical cyclone seasons starting no earlier than June (blog: Anticipated Return of El Niño). The rainfall amounts recorded in winter (Dec - Feb) 2014/15 and spring (Mar - May) 2015 were 118 and 606 mm respectively, both higher than the corresponding average seasonal rainfall under the ENSO-neutral state (Figure 1). The tropical cyclone season of 2015 started in June (Tropical Storm Kujira). All these observations were consistent with the statistical results.
Figure 1Winter (Dec-Feb) and spring (Mar-May) rainfall of Hong Kong under the ENSO-neutral state (green)
and El Niño (pink) during 1950-2015.
For the winter of 2015/16, the rainfall recorded at the Observatory up to early January 2016 already exceeded 120 mm. With the normal range of winter rainfall lying between 64 and 147 mm, therefore it is certain that this winter will end up with normal to above-normal rainfall, a trend again consistent with the tendency of relatively wet winters under El Niño.
In the aforementioned blog, we also pointed out that El Niño would not necessarily give rise to rainy summers in Hong Kong. In fact, the chance of above-normal rainfall was noticeably lower in El Niño summers than ENSO-neutral summers (Figure 2), as was the case in 2015 with the registered summer (Jun - Aug) rainfall of 852 mm falling into the "below-normal" category[2].
Figure 2Distribution of Hong Kong summer rainfall categories under the ENSO-neutral state (left)
and El Niño (right) during 1950-2015.
F C Sham
Notes:
[1] The ENSO-neutral state refers to the situation with neither an El Niño nor a La Niña in place, i.e. no warm (El Niño) or cold (La Niña) sea surface temperature anomalies in the central and eastern equatorial Pacific.
[2] Categorization of rainfall is based on the normal distribution constructed from climatological data in the previous 30 years. The categories are defined in such a way that the highest 30% and lowest 30% of the normal distribution are classified as "above-normal" and "below-normal" respectively, while the middle 40% represents the "normal" range.