Kidney and beach ball
17 September 2010
Forgive me for this rather weird title. The Observatory is under some pressure when it comes to warning people of approaching weather, especially typhoons. Too early a tropical cyclone signal is issued, the public may be baked in brilliant sunshine a couple of days before the effect of the storm is felt. Too late, and Hong Kong will risk the loss of life and properties because of inadequate forewarning.
As a matter of fact, Observatory colleagues start monitoring the development of a tropical cyclone days before a warning signal is issued. The work involves long hours of close watch and detailed analyses round-the-clock. Over the past few decades a number of tools for such analyses have been developed for the forecaster use. The device of funny names for these tools is a welcome relief.
As a tribute to Observatory colleagues, this blog introduces what are known to them as 'kidney' and 'beach ball'. Some of the tools have been presented to the public, notably in the annual Observatory Open Day and in seminars, as a sharing of scientific knowledge. This has generated considerable interest in Internet forum discussions.
What is a 'kidney' and why is it so called? Simply, it represents an area on the map where it is probable that windy conditions will affect a location in Hong Kong once a tropical cyclone comes within that area. Figure 1(a) shows a 50% probability 'kidney' for strong winds (i.e. force 6) at Waglan during the passage of a typhoon (the term 'typhoon', used in this blog covers typhoons, severe typhoons and super typhoons). Typhoon is the strongest amongst all categories of tropical cyclones.
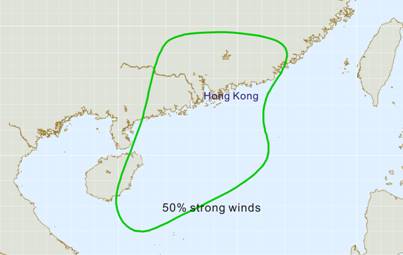
Figure 1(a)The 50% probability 'area' for strong
winds at Waglan during the passage of a typhoon
The 50% probability means that according to past records of typhoons affecting Hong Kong, half of those located inside the curve had brought strong winds to Waglan, an outlying island about 20 kilometres southeast of Central, Hong Kong. The shape of the curve in Figure 1 gives the tool's namesake. The curve's elongated shape towards the southwest also tells us that Waglan (and Hong Kong as a whole) is more exposed when the storm is located to the southwest of Hong Kong.

Figure 1(b)Start and cessation of strong winds at Waglan Island during the
passage of Typhoon Koppu in September 2009 based on estimation using
the 50% probability 'kidney'. The estimated times differ from the actual
by about 3 hours. The blue line shows the forecast track of Koppu.
So how would a forecaster use this tool? What he/she does is to overlay it onto the predicted storm track. This gives an indication of the time when the storm will give strong winds at Waglan, as well as when the winds will start to decrease, as shown in Figure 1(b).
Figure 2 presents the 30, 50 and 70% curves. The 70% probability curve means a 70% chance of strong winds at Waglan once a typhoon comes within that region. Naturally it is smaller than the 50% one, which in turn is smaller than the 30% one. How to choose among these curves? The forecaster assesses the extent of the storm itself, and may adopt a smaller probability in the case of an extensive storm and a higher probability for a compact storm.
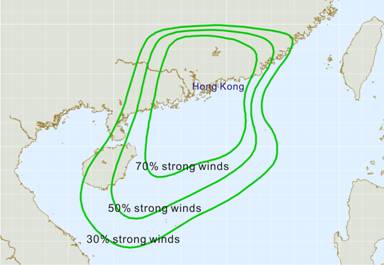
Figure 2 The 30%, 50% and 70% probability for strong
winds at Waglan brought by typhoons.
For a different storm category such as tropical depression, tropical storm or severe tropical storm, you need a different set of probability curves. The forecaster may have to grapple with more than one set of curves when the storm shows signs of intensification or weakening. There is also a different set of curves each for other locations such as Victoria Harbour and the airport.
Figures 1 and 2 tell us that Waglan is more exposed when the storm is located to our southwest. Well, they don't tell us where the winds are going to come from. To determine the wind direction, you need a 'beach ball'. An example of this is given in Figure 3.
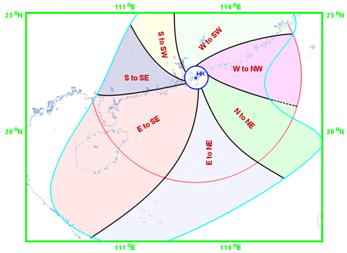
Figure 3Diagram showing the prevailing wind direction at
Waglan when a tropical cyclone is located in a particular sector
Looking at Figure 3, there is probably no need to explain why the tool is called a 'beach ball'. Thus, a storm located to the southwest of Hong Kong, say near Hainan Island, will bring east to southeasterly winds to Waglan.
The above tools were possible after years of experience and the accumulation of long periods of observations. The weather station at Waglan, for example, was established nearly 60 years ago, in 1952. The tools are a result of local knowledge.
The importance of 'local knowledge' cannot be over-emphasized. Take global weather forecast as an example. There are many inexpensive weather models in operation nowadays, some requiring the power of only a desktop personal computer. Are they accurate? Well, not necessarily. As a matter of fact, 40 degrees Celsius had been predicted for Hong Kong in day-to-day forecasts, whereas the highest temperature ever recorded in Hong Kong was 36 degrees at the Observatory headquarters and 38 degrees elsewhere within the territory.
It was for this reason that the Observatory, acting on behalf of the United Nations World Meteorological Organization (WMO) developed the World Weather Information Service (WWIS) in 2000. Day in and day out, the latest weather forecasts for over 1300 cities in the world are collected by a computer at the Observatory and automatically put on a website for free access by everybody. The weather forecasts come from a total of over 120 weather services from around the world and are available in eight languages. These are official forecasts, and are based on local knowledge that even the best weather prediction models in the world may not be able to replicate.
This year, a 'Future Version' of WWIS has been developed and is GIS-enabled (GIS stands for Geographic Information System). Now being showcased at the World Expo 2010 in Shanghai, it allows the user to freely pan, scroll, zoom in and out of the virtual globe, and quickly get to the city of interest where the weather forecast, some up to 3 to 7 days ahead, is instantaneously displayed. Next time you go abroad, be sure to use this service : http://future.worldweather.wmo.int/.
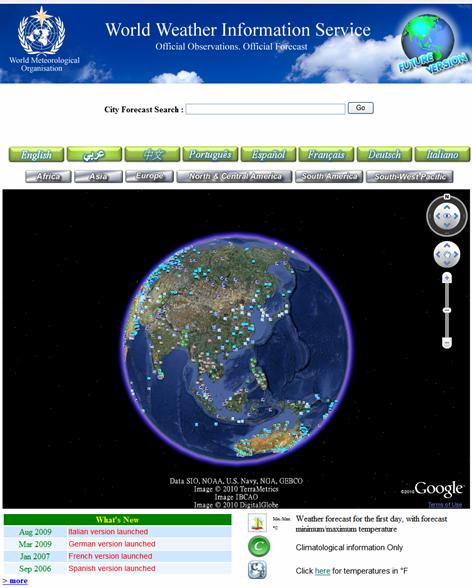
Figure 4'Future Version' of the World Weather Information Service
B.Y. Lee
Reference:
Probability of occurrence of gales in the harbour area of Hong Kong during the passage of tropical cyclones, by T.C. Lee & C.F. Ma.
Hong Kong Observatory Technical Note (Local) No. 81
As a matter of fact, Observatory colleagues start monitoring the development of a tropical cyclone days before a warning signal is issued. The work involves long hours of close watch and detailed analyses round-the-clock. Over the past few decades a number of tools for such analyses have been developed for the forecaster use. The device of funny names for these tools is a welcome relief.
As a tribute to Observatory colleagues, this blog introduces what are known to them as 'kidney' and 'beach ball'. Some of the tools have been presented to the public, notably in the annual Observatory Open Day and in seminars, as a sharing of scientific knowledge. This has generated considerable interest in Internet forum discussions.
What is a 'kidney' and why is it so called? Simply, it represents an area on the map where it is probable that windy conditions will affect a location in Hong Kong once a tropical cyclone comes within that area. Figure 1(a) shows a 50% probability 'kidney' for strong winds (i.e. force 6) at Waglan during the passage of a typhoon (the term 'typhoon', used in this blog covers typhoons, severe typhoons and super typhoons). Typhoon is the strongest amongst all categories of tropical cyclones.
Figure 1(a)The 50% probability 'area' for strong
winds at Waglan during the passage of a typhoon
The 50% probability means that according to past records of typhoons affecting Hong Kong, half of those located inside the curve had brought strong winds to Waglan, an outlying island about 20 kilometres southeast of Central, Hong Kong. The shape of the curve in Figure 1 gives the tool's namesake. The curve's elongated shape towards the southwest also tells us that Waglan (and Hong Kong as a whole) is more exposed when the storm is located to the southwest of Hong Kong.
Figure 1(b)Start and cessation of strong winds at Waglan Island during the
passage of Typhoon Koppu in September 2009 based on estimation using
the 50% probability 'kidney'. The estimated times differ from the actual
by about 3 hours. The blue line shows the forecast track of Koppu.
So how would a forecaster use this tool? What he/she does is to overlay it onto the predicted storm track. This gives an indication of the time when the storm will give strong winds at Waglan, as well as when the winds will start to decrease, as shown in Figure 1(b).
Figure 2 presents the 30, 50 and 70% curves. The 70% probability curve means a 70% chance of strong winds at Waglan once a typhoon comes within that region. Naturally it is smaller than the 50% one, which in turn is smaller than the 30% one. How to choose among these curves? The forecaster assesses the extent of the storm itself, and may adopt a smaller probability in the case of an extensive storm and a higher probability for a compact storm.
Figure 2 The 30%, 50% and 70% probability for strong
winds at Waglan brought by typhoons.
For a different storm category such as tropical depression, tropical storm or severe tropical storm, you need a different set of probability curves. The forecaster may have to grapple with more than one set of curves when the storm shows signs of intensification or weakening. There is also a different set of curves each for other locations such as Victoria Harbour and the airport.
Figures 1 and 2 tell us that Waglan is more exposed when the storm is located to our southwest. Well, they don't tell us where the winds are going to come from. To determine the wind direction, you need a 'beach ball'. An example of this is given in Figure 3.
Figure 3Diagram showing the prevailing wind direction at
Waglan when a tropical cyclone is located in a particular sector
Looking at Figure 3, there is probably no need to explain why the tool is called a 'beach ball'. Thus, a storm located to the southwest of Hong Kong, say near Hainan Island, will bring east to southeasterly winds to Waglan.
The above tools were possible after years of experience and the accumulation of long periods of observations. The weather station at Waglan, for example, was established nearly 60 years ago, in 1952. The tools are a result of local knowledge.
The importance of 'local knowledge' cannot be over-emphasized. Take global weather forecast as an example. There are many inexpensive weather models in operation nowadays, some requiring the power of only a desktop personal computer. Are they accurate? Well, not necessarily. As a matter of fact, 40 degrees Celsius had been predicted for Hong Kong in day-to-day forecasts, whereas the highest temperature ever recorded in Hong Kong was 36 degrees at the Observatory headquarters and 38 degrees elsewhere within the territory.
It was for this reason that the Observatory, acting on behalf of the United Nations World Meteorological Organization (WMO) developed the World Weather Information Service (WWIS) in 2000. Day in and day out, the latest weather forecasts for over 1300 cities in the world are collected by a computer at the Observatory and automatically put on a website for free access by everybody. The weather forecasts come from a total of over 120 weather services from around the world and are available in eight languages. These are official forecasts, and are based on local knowledge that even the best weather prediction models in the world may not be able to replicate.
This year, a 'Future Version' of WWIS has been developed and is GIS-enabled (GIS stands for Geographic Information System). Now being showcased at the World Expo 2010 in Shanghai, it allows the user to freely pan, scroll, zoom in and out of the virtual globe, and quickly get to the city of interest where the weather forecast, some up to 3 to 7 days ahead, is instantaneously displayed. Next time you go abroad, be sure to use this service : http://future.worldweather.wmo.int/.
Figure 4'Future Version' of the World Weather Information Service
B.Y. Lee
Reference:
Probability of occurrence of gales in the harbour area of Hong Kong during the passage of tropical cyclones, by T.C. Lee & C.F. Ma.
Hong Kong Observatory Technical Note (Local) No. 81