Polar Route Charts
|
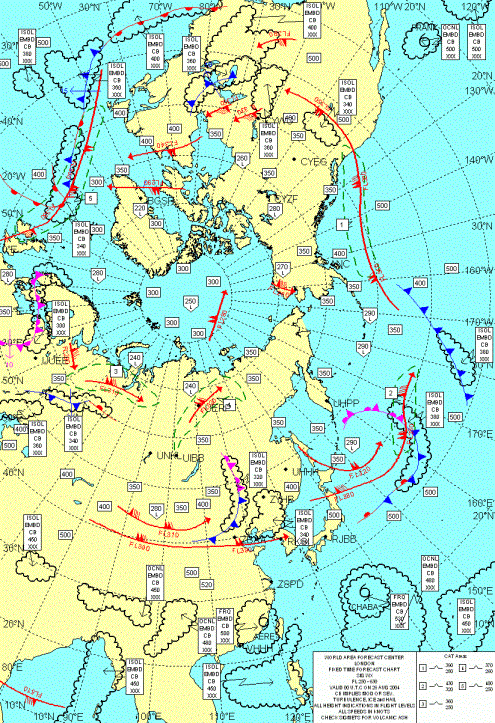
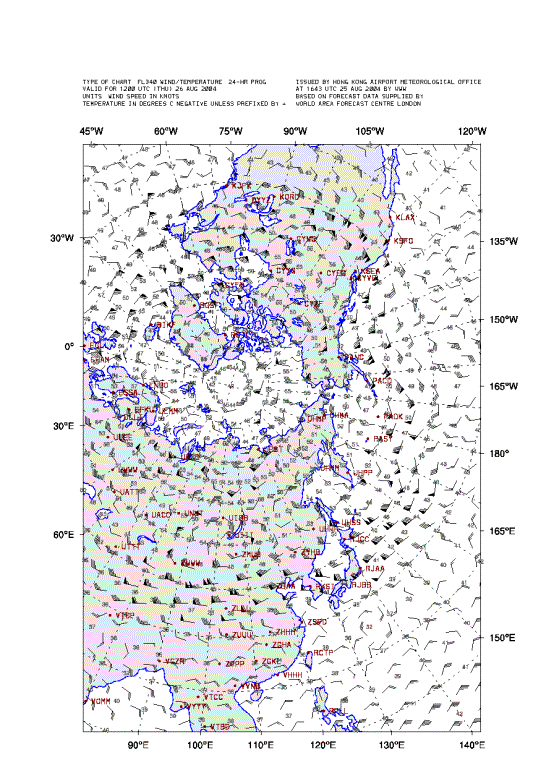
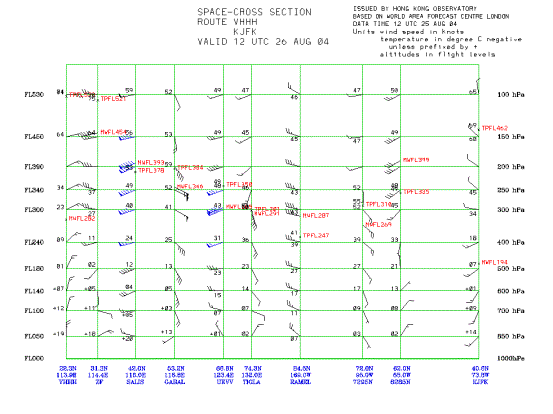
Significant weather (SIGWX) and upper-air wind-temperature charts for the polar region are now available on the Observatory's web-based Aviation Meteorological Information Dissemination System (AMIDS) for use by airlines. These charts are generated from the digitally-coded data received from the World Area Forecast Centre at London and are updated at 6-hour intervals. The chart area is tailored-made for flights via the polar routes over the North Pole regions. The SIGWX chart is presented in colours, making it easy for pilots to identify features in the chart (Figure 1). In particular, pilots can easily distinguish between significant cloud areas, fronts, jet streams and clear air turbulence areas. In addition to SIGWX chart, upper-air wind/temperature charts for flight levels from 050 to 530 are also made available at AMIDS (see example in Figure 2). In these charts, land is shaded in grey colour to ease visualization. Four-letter ICAO code for aerodromes are also overlaid to aid identification. To provide a comprehensive view of the upper-air temperatures and winds along flight route, vertical cross-section of a selected route via the North Pole is also generated for flight planning (Figure 3). These charts depict temperature and wind forecasts at various heights along the route. Information on tropopause levels and maximum wind levels is also shown on these charts. Airlines are welcomed to provide the Observatory (amids@hko.gov.hk) with their requirements for the specific routes so that more tailor-made charts can be produced to suit their operational needs. |
Figure 1. SIGWX chart for polar-route.
Figure 2. Upper-air wind/temperature chart tailored-made for polar-route.
Figure 3. Vertical space cross-section for a route from Hong Kong to New York via the polar region. |


