Skip Content

First wake vortex measurements at the Hong Kong International Airport

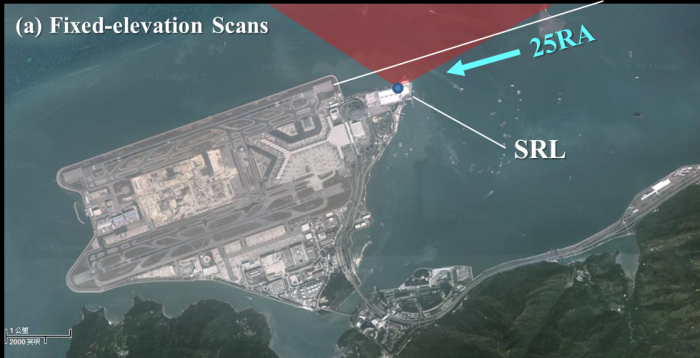
The Observatory has always been keen in applying the latest technology in advancing aviation meteorological service. Over the past few summers, a rented unit of short-range LIDAR (SRL) – a higher-resolution, more agile counterpart to the long-range LIDARs currently used in the alerting of low-level windshear – has been installed on the rooftop of the AsiaWorld-Expo to study the properties of building-induced windshear and turbulence at corridor 25RA. This was achieved by performing rapid near-horizontal planar scans, up to 3 times per minute, over the region spanned by the last 1 to 2 nautical miles before touch-down (Fig. 1a).

During the 2014 field campaign, opportunity was also taken to conduct vertical scans cutting across the flight path at right angles (Fig. 1b) on selected dates. This allowed, for the first time at the Hong Kong International Airport (HKIA), the two-dimensional wind structure of wake vortices left behind by arriving aircraft be mapped out.

A typical sequence of wake vortex evolution as visualised by the SRL is given in Fig. 2. Here the vortex pair is represented as a quartet of colour pixels carrying opposite line-of-sight velocities, and can be seen to move along with the background wind flow while gradually sinking to the surface.

The observation of the wake vortices is expected to be the first step in understanding the evolution and dissipation characteristics of such vortices in Hong Kong. Such information may be useful to arrange more efficient sequencing of aircraft through mitigation of the effect of these vortices in the operation on the aircraft.

With support from aviation users, the Observatory will continue making similar measurements in the coming years, with a view to better understanding and eventually predicting wake vortex behaviour at HKIA.

Schematic diagram of near-horizontal planar scans over corridor 25RA using the short-range LIDAR installed on top of the AsiaWorld-Expo.

Schematic diagram of vertical planar scans over corridor 25RA using the short-range LIDAR installed on top of the AsiaWorld-Expo.

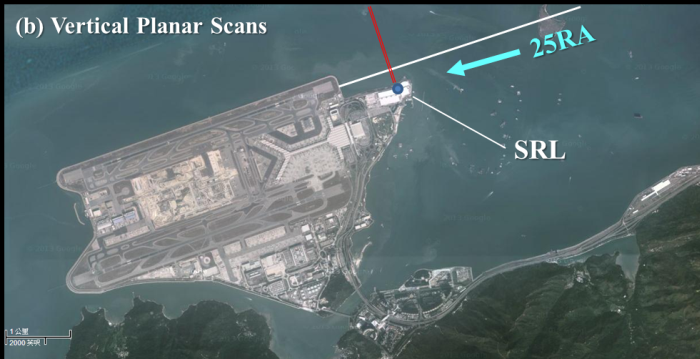
Figure 1 Schematic diagram of (a) near-horizontal planar scans and (b) vertical planar scans over corridor 25RA using the short-range LIDAR installed on top of the AsiaWorld-Expo.

Sample sequence of wake vortex evolution as measured by the short-range LIDAR along a cross-section of corridor 25RA.  Images are separated by intervals of 10 seconds.  The wake vortex pair is represented by the quartet of colour pixels carrying wind speeds in the opposite sense.

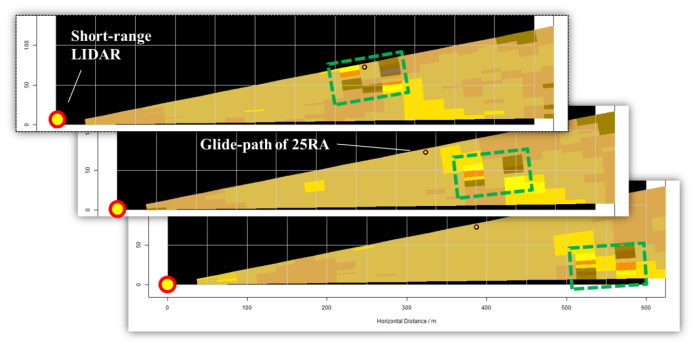
Figure 2  Sample sequence of wake vortex evolution as measured by the short-range LIDAR along a cross-section of corridor 25RA. Images are separated by intervals of 10 seconds. The wake vortex pair is represented by the quartet of colour pixels carrying wind speeds in the opposite sense.