Unleash of Waves from Tonga Volcanic Eruption Spreading over Sea, Land and Air
30 April 2022
Queenie CC Lam and David TW HuiAs everyone knows, a gigantic submarine volcanic eruption occurred at Tonga in the South Pacific Ocean at around noon Hong Kong time (04 UTC) on 15 January 2022 (Global Volcanism Program, 2022). It was such an unusual event that it attracted the eyes of volcanologists, seismologists, oceanographers, meteorologists and climatologists alike. The submarine volcano, named Hunga-Tonga Hunga-Ha'apai (hereinafter as Tonga volcano), ejected a huge plume of ash soaring into the upper atmosphere and triggered a trans-basin tsunami that destroyed homes and caused several deaths on Tonga's nearby islands. The tsunami waves were recorded by buoy sensors and tide gauge stations on the coastal region of the Pacific Ocean and the South China Sea. People in places nearby Tonga heard a big explosion and smelt a strong odour of sulphur following the eruption. The eruption induced shock waves that circled the globe multiple times. The shock waves, which triggered pressure waves in the atmosphere and across the ocean surface, caused tsunami-like waves called meteotsunami in the Caribbean, Atlantic Ocean, Indian Ocean and the South China Sea.
Let's take a closer look at the peculiarities of the Tonga volcanic eruption and different types of waves rippled through the atmosphere, land and seas round the globe as revealed from meteorological, geophysical and oceanographic observations.
1. Satellite observations showing gigantic volcanic eruption plume reaching the mesosphere
Satellite observations (NASA, 2022) and the upper-air disturbances detected by GPS satellites prompted that the eruption plume reached as high as 80-90 km. It is rare to see a volcanic eruption plume reaching such a height. The reason is that the steam and volcanic gas including sulphur dioxide mixed into the magma before upwelling fuelled the explosion and high plumes.
An animation of lightning strikes, which were generated by rapid collisions of gas particles and detected by Global Lightning Detection Network (GLD360), shows the spread of circular ripples (meteorologically called “gravity waves”) (Figure 1(a)). There were as much as about 200,000 lightning strikes between 04 and 05 UTC (UTC = Hong Kong Time - 8h) on 15 January and the total number of lightning strikes on that day amounted to nearly 400,000. A ground capture of the lighting flash during the period sourced from Tonga Geological Services is shown in Figure 1(b).
(a)
(b)
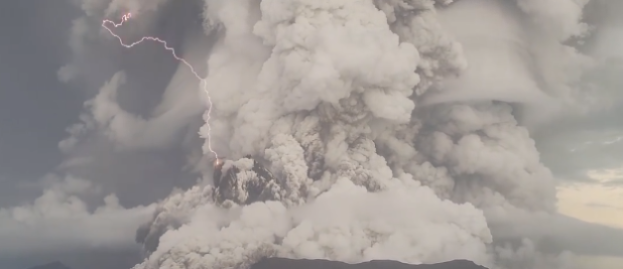
Figure 1. (a) Animation of lightning strikes associated with the Tonga volcanic eruption as recorded by GLD360 (red dots) overlaid on IR satellite imagery from Himawari-8 during 04-16 UTC on 15 January 2022 within the area of 10-30 °S, 170E-165 °W; (b) lightning strike observed on the ground during the period (Source: Tonga Geological Services).
2. Waves in Air - Shock Waves
The gigantic eruption generated shock waves which could first be observed between 04:10 and 04:20 UTC on 15 January 2022 from satellite observations on water vapour channels (Figure 2). The shock waves were similar to ripples or circles spreading from the point where a rock hits the water and becoming less defined as they travel outwards.
Figure 2. Animation of Time Difference images derived from Japanese Himawari-8 low level water vapour channel (6.25 µm) from 04:10 UTC 15 January to 23:50 UTC 17 January 2022 showing shock waves triggered from the volcanic eruption travelling around the globe.
The shock waves in the air is pressure waves that were observed at many places around the world including Hong Kong. Figure 3 shows the wave fronts spreading out from the location of eruption and the travelling pathways of the pressure waves that hit Hong Kong, one in the Northwest direction (first wave to Hong Kong, thick blue arrows in Figure 3) and other one in the Southeast direction (second wave to Hong Kong from the other side of the earth, yellow arrows in Figure 3). The atmospheric pressure waves were propagating at a speed of about 310 m/s (taking around 8 hours to reach Hong Kong at a distance of about 9,000 kilometres). Up to around five pressure waves were discernible from pressure readings at Waglan Island (Figure 4). The 1st wave brought about a pressure change of around 2 hPa upon arrival, similar to the pressure change observation at Chichijima in Japan (Figure 5(a)). The 2nd wave arrived from the opposite direction carrying much less energy as evident from a smaller pressure change that it brought. The 3rd wave (thin blue arrows in Figure 3) and the 5th wave were in fact originated from the 1st but travelled round the globe once and twice respectively. Similarly, the 4th wave was originated from the 2nd wave that had travelled round the globe once before arrival.
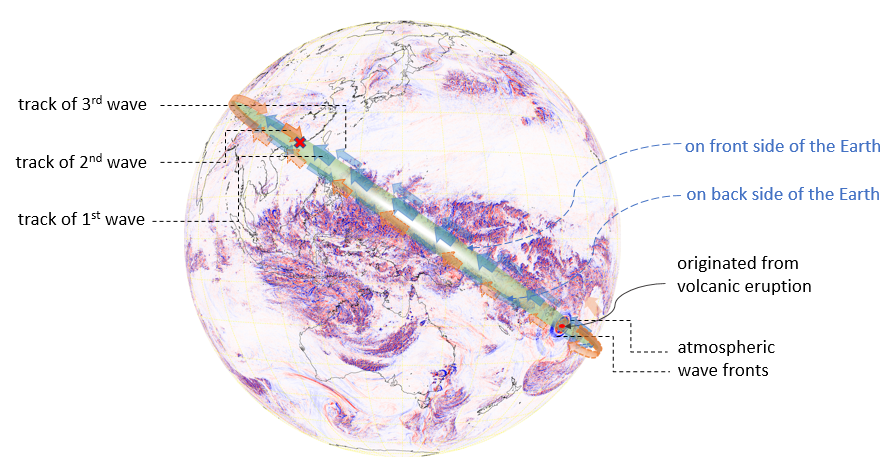
Figure 3. A schematic diagram overlaid on the satellite imagery of water vapour channel at 0520 UTC 15 January 2022 showing the tracks of the atmospheric pressure waves originated from the volcanic eruption (red dot) travelling to Hong Kong (red cross), first wave (short thick blue arrows) coming from the southeast, second wave (yellow arrows) coming from the northwest, and the third wave (long thin blue arrows) coming from the southeast again but round the globe once, as an illustration.
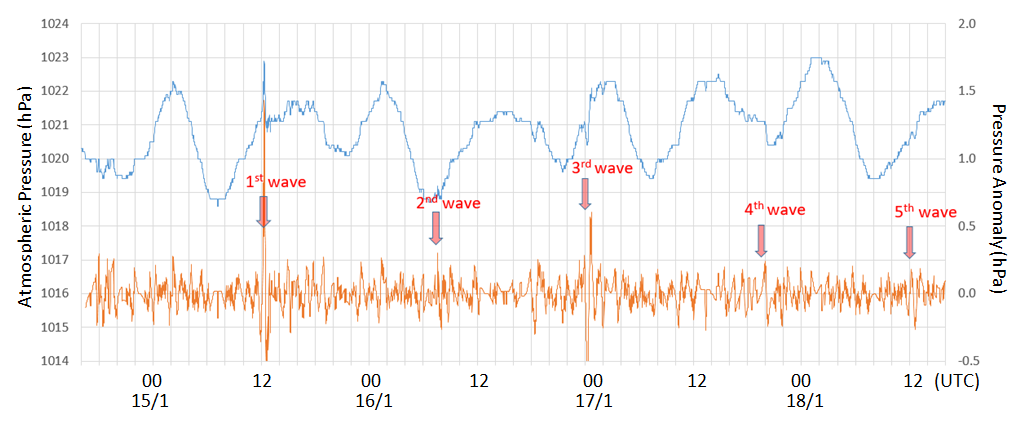
Figure 4. Time series of the 1-minute mean sea-level pressure (blue trace) and anomaly (orange trace) at Waglan Island, Hong Kong. Estimation of the arrival times of the first five pressure waves were marked.
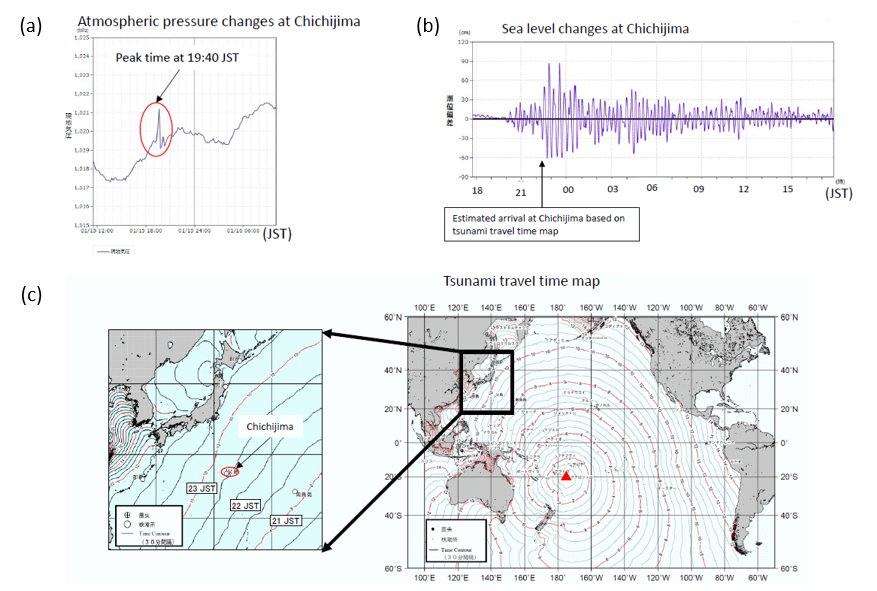
Figure 5. Observations of (a) atmospheric pressure change and (b) sea level change at Chichijima in Japan; (c) tsunami travel time map (Source: Japan Meteorological Agency; JST = UTC +9 h).
3. Waves in Land – Seismic Waves
Global seismic stations detected seismic signals that propagated through the land mass from the volcanic eruption. The United States Geological Survey (USGS) calculated a surface wave of magnitude 5.8 at 20.546°S, 175.390°W with zero depth and an origin time of 04:14:45 UTC based on techniques calibrated for earthquakes in their post-analysis (USGS, 2022). The broadband seismograph at Po Shan station in Hong Kong also detected the arrival of seismic body wave (technically named P-wave that shakes the ground back and forth in the same direction as the direction of the wave coming from the source of vibration) at 04:27 UTC (Figure 6). The first seismic wave took about 12 minutes to reach Hong Kong.
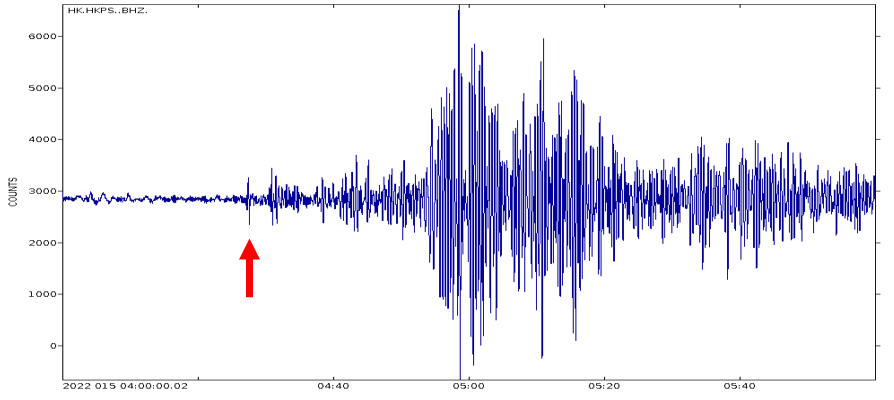
Figure 6. Seismic waveform indicating the arrival of P-wave (indicated by red arrow) detected by the broadband seismograph at Hong Kong Po Shan station at around 04:27 UTC on 15 January 2022.
4. Waves across the Seas – Meteotsunami and Tsunami Waves
The Tonga volcanic eruption triggered tsunami waves as high as around 15 m over local areas of Tonga islands, up to nearly 2 m in some coastal places of New Zealand, Chile and Japan, and 0.1-0.2 m as far as some coastal places in China (IOC, 2022).
The tsunami waves have long wavelength (distance between two adjacent wave crests) as compared with the depth of the ocean. For long waves, their speed of propagation is independent of the wavelength and frequency. Tsunami travel time (TTT) chart can thus be compiled in advance based on the depth of oceans at different parts of the world. Figure 7 shows the TTT chart indicating that the tsunami waves would take 14-15 hours to reach Hong Kong, and the estimated tsunami arrival time (ETA) of tsunami waves would thus be 18-19 UTC on 15 January 2022. However in Hong Kong, small fluctuations of sea level were seen before the ETA as in many other places in the Pacific regions, for example like Chichijima in Japan (Figure 5(b)). Those small fluctuations are not the aforementioned tsunami waves travelling through water body, but sea surface waves named “meteorological tsunamis” or “meteotsunamis” triggered by atmospheric pressure waves of high translational speed from meteorological aspect (Dogan GG, et al., 2021).
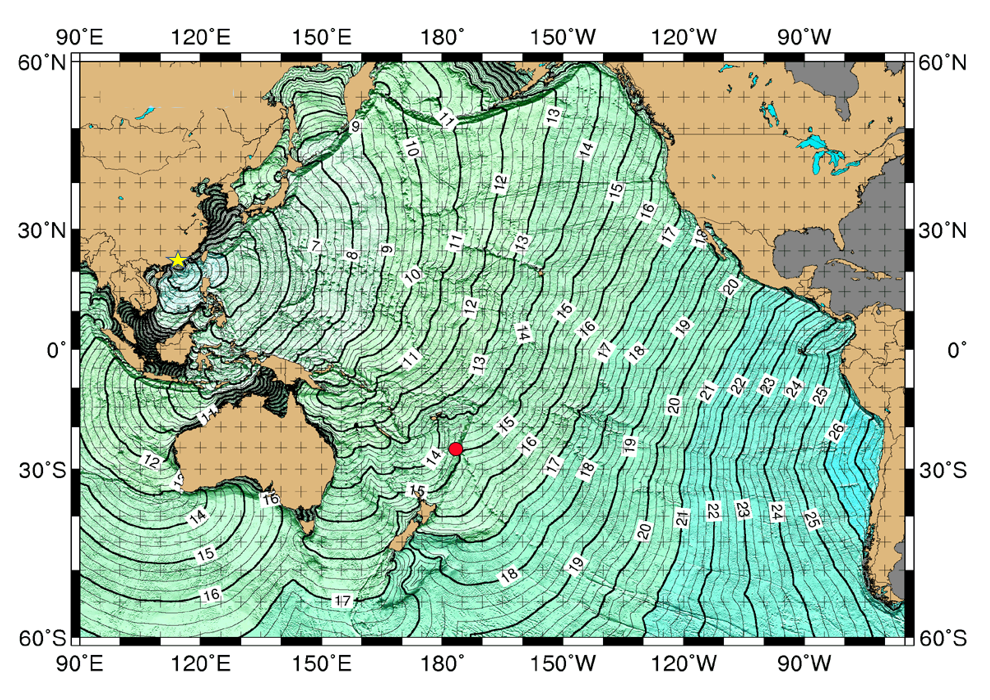
Figure 7. Tsunami Travel Time (TTT) chart marking the estimated time required for the tsunami waves reaching Hong Kong. The origin of seismic waves associated with the Tonga volcanic eruption as derived by USGS on 15 January 2022 is marked by the red dot and the location of Hong Kong is indicated by the yellow star.
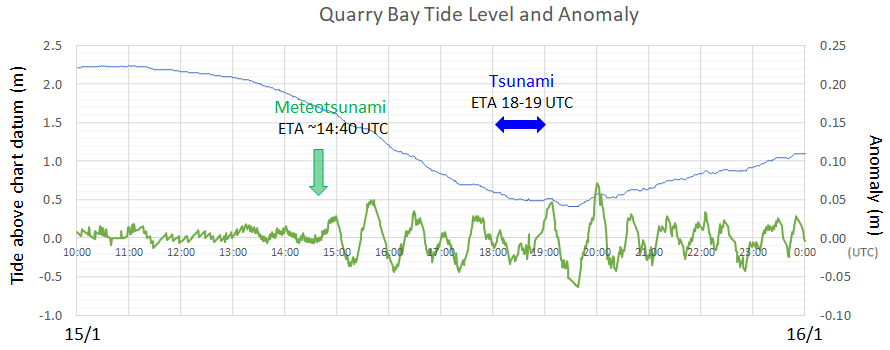
A schematic diagram in Figure 8 shows the fast moving atmospheric pressure wave triggering meteotusnami wave as well as amplification of long waves associated with meteotsunami and tsunami due to shoaling effect of the South China Sea continental shelf though there is energy dissipation through friction and turbulence. The meteotusnami waves reached Hong Kong around 3-4 hours before the estimated time of arrival of tsunami waves, and around 2.5 hours after the arrival of the first atmospheric pressure wave. The coupling of meteotsunami waves and tsunami waves makes it difficult to identify the arrival time of tsunami waves from time series analysis. The tsunami waves brought slight changes to the water levels in Hong Kong. The maximum amplitude of the tsunami waves was estimated to be about 7 cm at Quarry Bay and about 10 cm at Shek Pik (Figure 9).
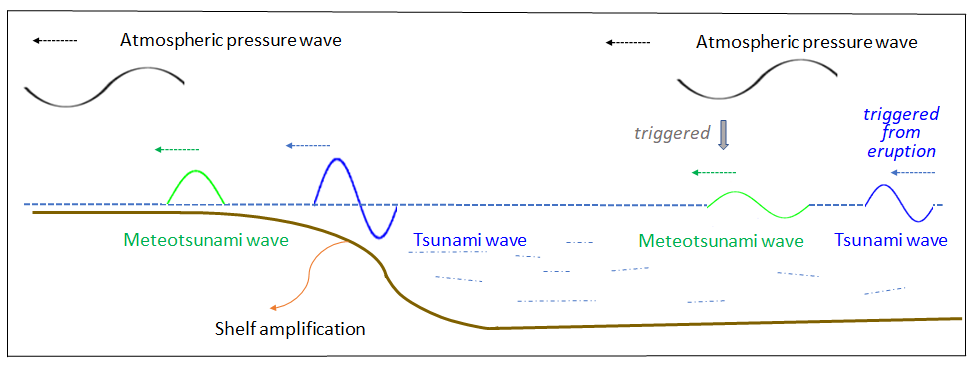
Figure 8. A schematic diagram showing meteotsunami wave (in green) induced by fast moving atmospheric pressure wave and 'usual' tsunami wave (in blue) triggered from the eruption. Both the long waves associated with meteotsunami and tsunami were amplified due to the effect of the shelf.
(a)
(b)
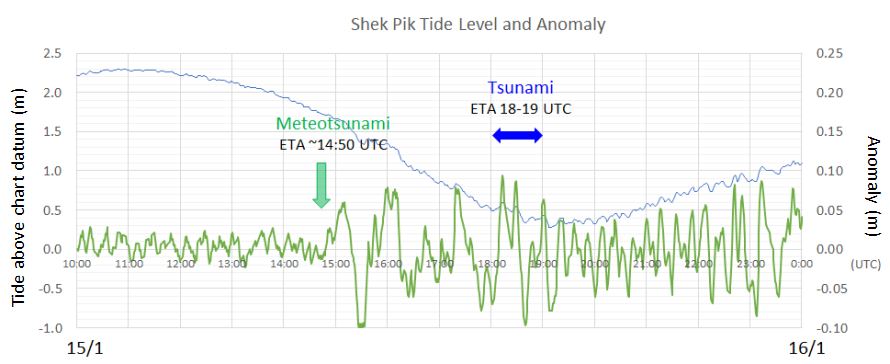
Figure 9. Time series of sea level data (blue) and anomaly showing sea level change after tide removal (green) at (a) Quarry Bay and (b) Shek Pik tide gauge station in Hong Kong on 15 January 2022.
It was unusual to see the different types of waves co-existing and affecting the whole globe from the same origin. It was made possible owing to the gigantic scale of the submarine volcanic eruption that was rarely seen.
Acknowledgement
Thanks are extended to CK So and Kenny Wong for generating animations of satellite imageries and GLD360 lightning data.