A Wake up Call from Mangkhut
29 October 2018
Mangkhut, packing extremely high winds and record-breaking storm surge, hit Hong Kong and caused widespread destruction on 16 September 2018. The scenes of roaring high winds ravaging the city and huge waves smashing the shoreline were unforgettable to many of us. Many people also experienced for the first time swaying of buildings, and shaking of doors and windows due to the ferocious winds, and appreciated the ability to stay in a safe place. According to the available information, at least 458 people were injured. There were many incidents of falling objects and building damages, at least 500 reports of smashed windows or glass curtain walls, and more than 60,000 reports of fallen trees, the highest number on record. Electricity supply to over 40,000 households in Hong Kong were interrupted, including Sai Kung, Cheung Chau, Kat O, Tung Ping Chau, individual buildings in Tseung Kwan O and Heng Fa Chuen, and rural areas in the western and northern New Territories (Figure 1). Power outage to some 13,500 households lasted for more than 24 hours, and the electricity supply to some remote areas and individual buildings were not fully restored even after four days. Supply of fresh water in some places was also affected due to power outages. Hundreds of vessels of various sizes were stranded, sunk or seriously damaged by the powerful waves. Heavy rain, storm surge and high waves caused serious flooding in many coastal and low-lying areas, including Tai O, Shek Pik, Mui Wo, Cheung Chau, Heng Fa Chuen, Siu Sai Wan, South Horizons, Lei Yue Mun, Tseung Kwan O, Sha Tin, Tai Po, Sai Kung, Yuen Long, Lau Fau Shan, Sha Tau Kok and Peng Chau (Figure 2). Many coastal structures were also substantially damaged, including sewage treatment works, public beaches, and waterfront promenades. Sea, land and air transportation services were paralyzed on the day Mangkhut battered Hong Kong. Owing to fallen trees and flooding, parts of the major roads were still closed and public transports could not be fully resumed the next day. Among those typhoons that affected the territory, Mangkhut is truly one of the most destructive storms in the past three decades.
Up till now (29 October 2018), including Mangkhut, there are in total 16 typhoons that necessitated the issuance of the Hurricane Signal No. 10 (Note 1) in Hong Kong since World War II. This article will concisely review the wind strength, storm surge and rainfall brought by Mangkhut to see how ferocious Mangkhut was as compared to other "Signal No. 10" typhoons in the past.
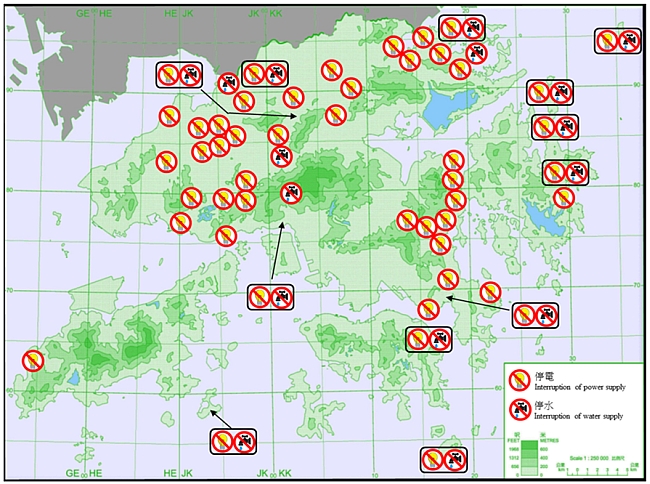
Figure 1 Reports of interruption of power and water supply under the influence of Mangkhut based on news and social media. The incident reports are not exhaustive.
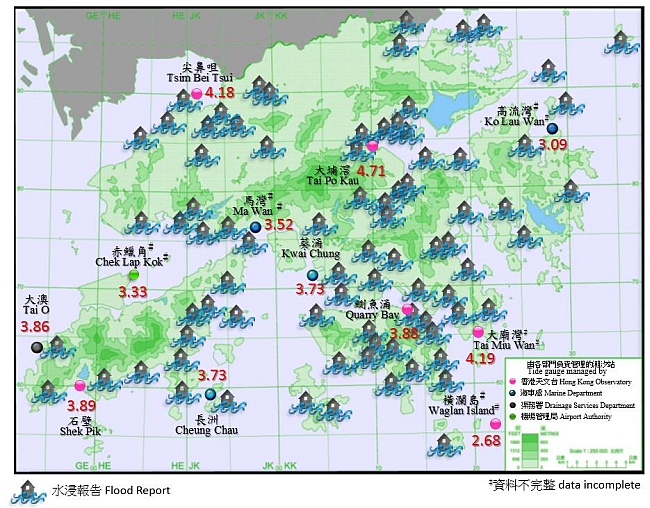
Figure 2 Maximum sea level (metres above Chart Datum) recorded at various tide gauges in Hong Kong and flood reports from government departments, news and social media on 16 September 2018. The flood reports are not exhaustive.
Maximum Intensity of the Storm
Mangkhut reached its peak intensity before making landfall over Luzon on 14 September 2018, with a maximum sustained wind of 250 km/h (10-minute average). By comparing the maximum intensity in the whole storm life cycle, it is the strongest among the 16 "Signal No. 10" typhoons, even exceeding Hope in 1979 (Table 1). Mangkhut then moved across the northern part of Luzon and weakened under the influence of terrain. After entering the South China Sea, Mangkhut maintained a marginal super typhoon strength and further weakened into a severe typhoon when it came close to Hong Kong. If the track of Mangkhut shifted slightly northwards and entered the South China Sea through the Luzon Strait, its intensity when approaching Hong Kong would likely be stronger than what it was on that day.
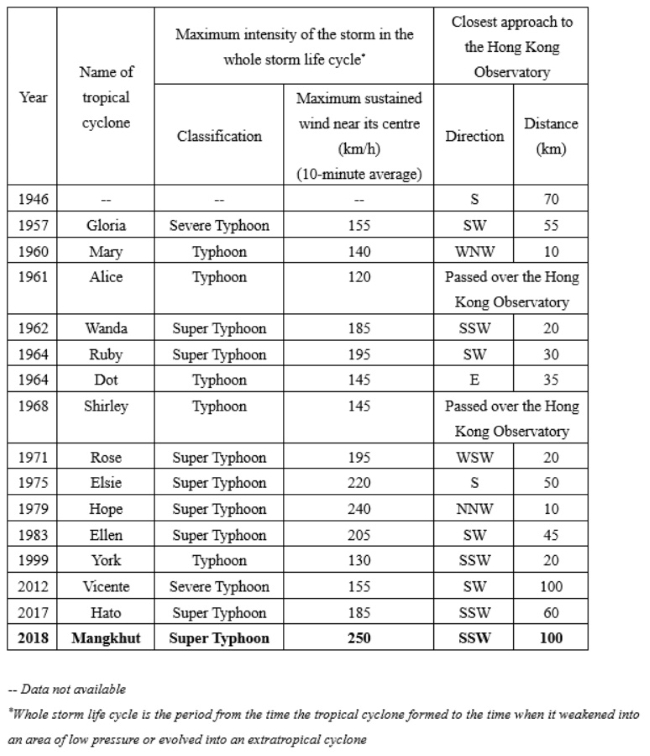
Table 1 A comparison of Super Typhoon Mangkhut and other typhoons necessitating the issuance of the Hurricane Signal No. 10.
Winds over Hong Kong
Present analysis showed that Mangkhut passed about 100 km south-southwest of Hong Kong. Together with Vicente, they are both the farthest "Signal No.10" typhoons (Table 1). In terms of the overall wind strength over Hong Kong, Mangkhut is indeed one of the top notches among the "Signal No. 10" typhoons (Table 2), and is far stronger than York, Vicente, and Hato in recent years. The maximum 60-minute mean wind speeds recorded at Waglan Island and Cheung Chau were 161 km/h and 157 km/h respectively during the passage of Mangkhut. Both are the second highest records at the corresponding stations, just lower than the record high of Ellen in 1983 and exceeding the records of other historical typhoons in Hong Kong such as Wanda (1962), Rose (1971) and Hope (1979). Gusts over 150 km/h were registered in most parts of the territory during the day and a maximum gust of 256 km/h was recorded at Tate's Cairn, ranking after Wanda (1962) and Ruby (1964) as the third highest for that station.
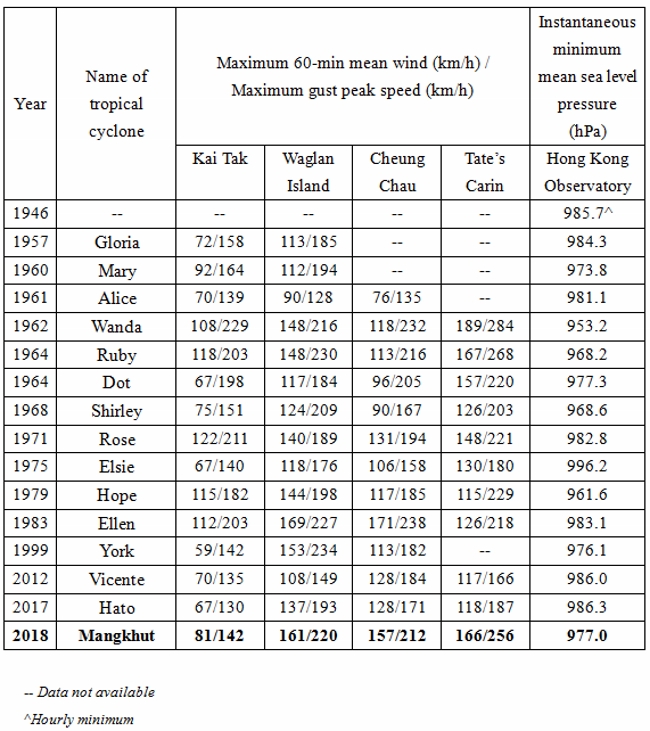
Table 2 Maximum 60-min mean wind speeds and maximum gust during the passages of typhoons necessitating the issuance of the Hurricane Signal No. 10.
Winds over Hong Kong were stronger than places like Macao, Zhuhai and Taishan during the passage of Mangkhut. One might ask why the winds were stronger over Hong Kong which was further away from the centre of Mangkhut as compared with these places. To address this question, let's first take a look at the wind structure of a tropical cyclone. In general, the highest winds are confined to the eyewall, a ring of intense rainband around the eye in a mature typhoon [1]. The microwave image of Mangkhut before it crossed Luzon clearly depicted the intense convection at the eyewall and its typical wind structure (Figure 3). After Mangkhut passed the northern part of Luzon, its intensity weakened owing to the interaction with land. Although the eyewall rebuilt when it traversed the northern part of the South China Sea, the convection of the eyewall was significantly weaker than that before crossing Luzon. On the contrary, the convection of the spiral rainband outside the eyewall remained intense and the structure was intact.
As Mangkhut skirted to the south-southwest of Hong Kong on 16 September 2018, radar pictures showed that the intense spiral rainband between 100 and 200 kilometres from its centre swept across Hong Kong during the day. On the other hand, the convection over the eyewall which was close to the centre was significantly weaker (Figure 4). Moreover, Mangkhut moved rapidly west-northwestwards across the northern part of the South China Sea with a speed once reaching 35 km/h (six-hour average), ranking the second fastest among the Signal No.10 typhoons and just after the 42 km/h of Hope in 1979. With Hong Kong staying in the right semicircle of the storm (the dangerous semicircle [2]) for a long time, the superposition of wind speed and moving speed of the storm brought destructive winds to Hong Kong most of the time during the day. Present analysis also showed that the wind speeds registered by Huangmao Zhou anemometer, which was affected by the eyewall of Mangkhut, were lower than those of Waglan Island and Cheung Chau which were further away from Mangkhut (Figure 5). Analysis of microwave image (Figure 3), radar image (Figure 4) and surface observations revealed that, when Mangkhut traversed the South China Sea and was close to the Pearl River Estuary, the winds over the spiral rainband outside the eyewall were stronger than those at the eyewall. As a result, the wind strength experienced by Hong Kong was stronger than places like Macao, Zhuhai and Taishan.
In gist, although Mangkhut weakened slightly into a severe typhoon near Hong Kong on the morning of 16 September with a maximum wind of 175 km/h (10-minute average), slightly lower than Super Typhoon Hato (185 km/h) last year, due to Mangkhut's extensive circulation (Figures 6 and 7), fast movement and special wind structure, Hong Kong was persistently affected by the most violent and destructive spiral rainband of Mangkhut on that day. Maximum 10-minute average wind speeds over 170 km/h were registered at some offshore areas. The automatic weather station under testing at Clear Water Bay even recorded a maximum 10-minute average wind speed of 191 km/h (Note 2), which is believed to be the highest record (except high grounds) since the Observatory's commencement of automatic weather station installation in Hong Kong in the 1980s.
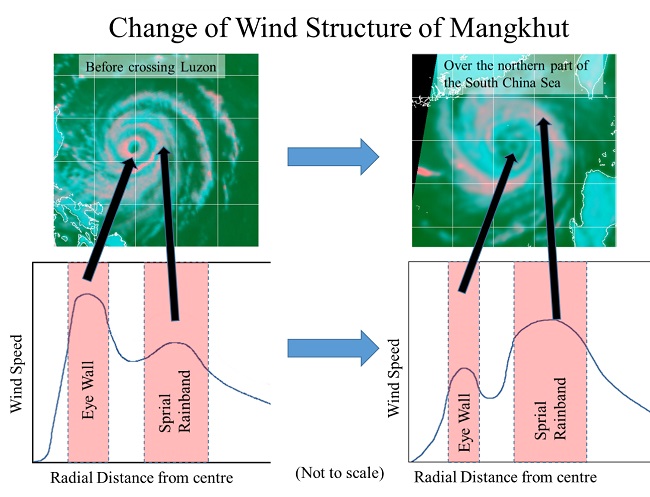
Figure 3 Change of wind structure of Mangkhut before crossing Luzon and over the northern part of the South China Sea.
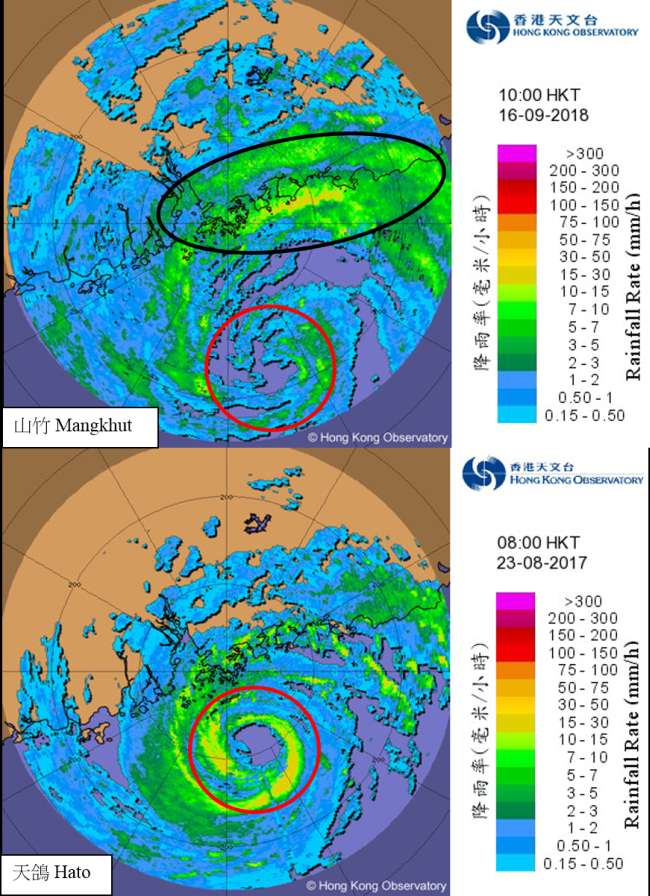
Figure 4 (Top panel) Radar imagery of Mangkhut at 10 a.m. on 16 September 2018, with the intense spiral rainband outside the eye wall of Mangkhut affecting Hong Kong (highlighted in black). On the contrary, convection was significantly weaker near the centre of Mangkhut (red circle). (Bottom panel) Radar imagery of Hato at 8 a.m. on 23 August 2017. The convection near the centre of Hato (red circle) was much more intense than that of Mangkhut.
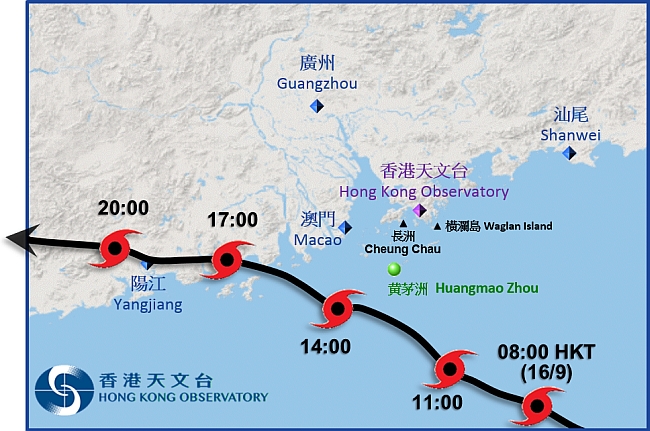
Figure 5 Track of Mangkhut near Hong Kong
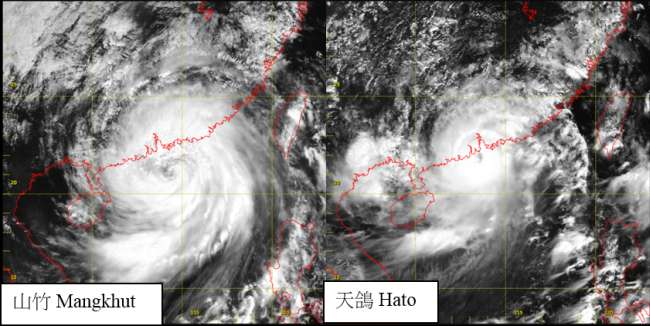
Figure 6 (Left panel) Visible satellite imagery of Mangkhut at 11 a.m. on 16 September 2018. (Right panel) Visible satellite imagery of Hato at 11 a.m. on 23 August 2017 (on same scale). The circulation and convective clouds of Mangkhut are much more extensive than those of Hato.
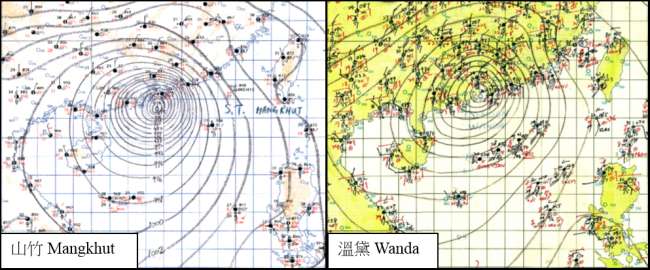
Figure 7 (Left panel) Weather chart of Mangkhut at 2 p.m. on 16 September 2018. (Right panel) Weather chart of Wanda at 3 p.m. (Summer Time) on 1 September 1962 (on same scale). While both Mangkhut and Wanda were large storms, the outermost closed isobar of Mangkhut was slightly larger than that of Wanda.
Storm Surge
Mangkhut's track is a typical one causing severe storm surge in Hong Kong [3]. With the storm skirting past to the south-southwest of Hong Kong, the associated ferocious east and southeasterly winds pushed water towards the shore and piled up against the coast. In addition, Mangkhut's extensive circulation drove a more extensive area of the ocean which in turn raised the water level further [4]. The severe storm surge (the increase of water level by the storm) induced by Mangkhut raised the water level in Hong Kong generally by more than 2 metres, leading to substantial inundation of many low-lying areas along the coast of Hong Kong. Record-breaking storm surge was also recorded in many parts of the territory. The maximum storm surge registered at Quarry Bay inside the Victoria Harbour and Tai Po Kau inside the Tolo Harbour were both the highest since instrumental records began at these stations, exceeding Hagupit (2008), Hato (2017), and even Hope (1979) and Wanda (1962) (Tables 3 and 4).
The sea level (the sum of astronomical tide and storm surge, Figure 8) of Quarry Bay rose to a maximum of 3.88 metres (above Chart Datum, same below), exceeding the 3.57 metres registered during the passage of Hato in 2017, and only lower than the record high of 3.96 metres set by Wanda in 1962. A maximum water level of 4.71 metres was recorded at Tai Po Kau, also only lower than the record high of 5.03 metres set by Wanda.
The day Mangkhut hit Hong Kong fell on the seventh day of the eighth month of the lunar calendar, which was close to a neap tide day. Should Mangkhut have hit Hong Kong during the spring tide like what happened during the passage of Hato in 2017, the maximum water level inside the Victoria Harbour and Tolo Harbour would be close to 4.9 metres and 5.9 metres respectively (assuming an astronomical high tide of 2.5 metres), or about one metre higher than the current record and would definitely lead to more substantial damages!
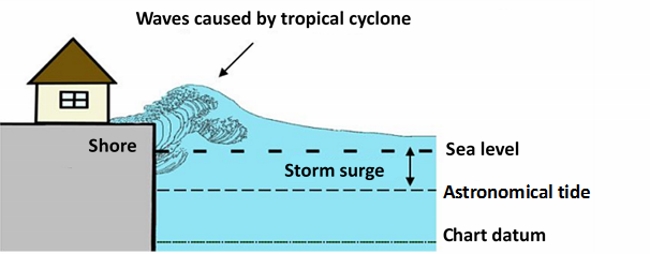
Figure 8 Relationship between sea level, astronomical tide and storm surge.
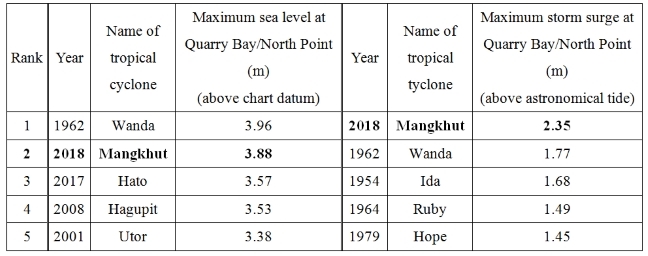
Table 3 Maximum sea level and storm surge recorded at Quarry Bay/North Point during the passage of tropical cyclones (since 1954).
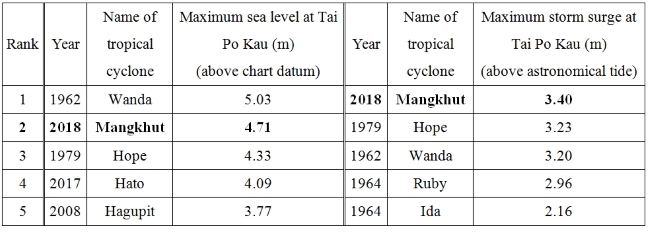
Table 4 Maximum sea level and storm surge recorded at Tai Po Kau during the passage of tropical cyclones (since 1962).
Rainfall
More than 150 millimetres of rainfall were recorded generally over Hong Kong on the day when Mangkhut hit Hong Kong, which ranks in the middle among the "Signal No. 10" typhoons (Table 5). In particular, 167.5 millimetres of rainfall were recorded at the Hong Kong Observatory Headquarters on that day, nearly 100 millimetres more than that when Hato struck Hong Kong last year. As regards the total rainfall brought by a tropical cyclone (Note 3), Mangkhut merely brought 180.7 millimetres of rainfall to Hong Kong. The wettest tropical cyclone in Hong Kong since 1884 is Typhoon Sam in August 1999. Even though Sam only necessitated the issuance of Signal No. 8 in Hong Kong, its circulation together with its trailing southwesterly winds brought torrential rain to Hong Kong during its passage and the following three days. The total rainfall recorded at the Hong Kong Observatory Headquarters amounted to 616.5 millimetres, which is about 43% higher than the normal value in August (Note 4).
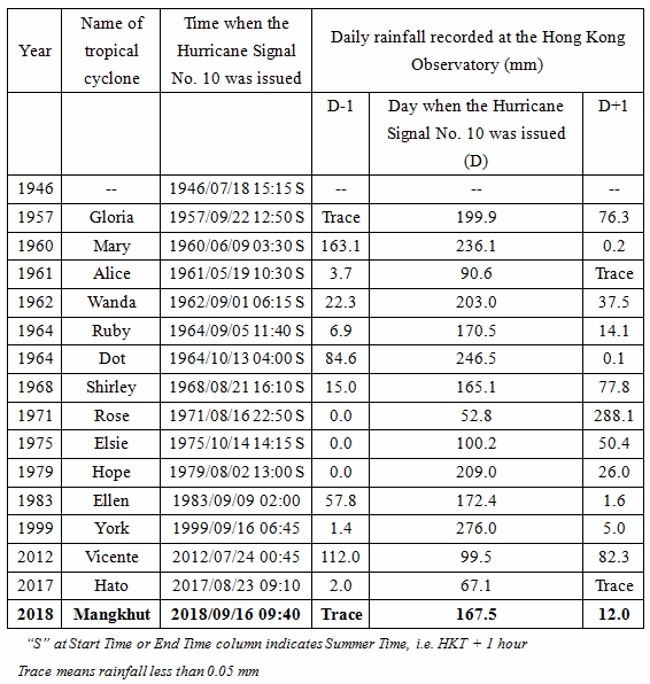
Table 5 Daily rainfall recorded at the Hong Kong Observatory Headquarters during the passages of Mangkhut and other typhoons necessitating the issuance of the Hurricane Signal No. 10. The day when the Hurricane Signal No. 10 was issued, as well as the day before and after, are considered.
Concluding remarks
The widespread destruction in Hong Kong brought by Mangkhut is the most serious in the recent three decades. As a result of global warming, a warming ocean will provide more energy to fuel the storms in the future. The number of intense tropical cyclones and the associated precipitation rate will increase. Sea level rise caused by global warming will raise the frequency and threat of severe storm surge. Mangkhut is indeed a wake-up call for many of us, reminding us the powerful force of nature and the challenges of climate change. We must stay vigilant and be fully prepared to face the even bigger threats of tropical cyclones and extreme weather in the future.
CHOY Chun-wing and WU Man-chi
Notes:
1. Hurricane Signal No. 10 has been the highest tropical cyclone warning signal in Hong Kong since 1931. During the period between 1917 and 1930, Signal No. 7 was the highest tropical cyclone warning signal in Hong Kong, signifying hurricane force winds in Hong Kong.
2. The automatic weather station at Clear Water Bay is located on a complex terrain with the anemometer at an elevation over 70 metres above sea level. The corresponding wind speed near sea level is estimated to be lower than 185 km/h.
3. The rainfall brought by a tropical cyclone is defined as the total rainfall recorded at the Hong Kong Observatory Headquarters from the time when a tropical cyclone comes within 600 km of Hong Kong to 72 hours after it has dissipated or moved outside 600 km range of Hong Kong.
4. Climatological normal rainfall (1981 - 2010) in August is 432.2 millimetres.
Reference:
[1] C. C. Chan : Structure of Typhoons
https://www.hko.gov.hk/education/edu01met/01met_tropical_cyclones/ele_typhoon_e.htm
[2] W. Kong : Tropical Cyclone : To the East, To the West?
https://www.hko.gov.hk/blog/en/archives/00000103.htm
[3] B. Y. Lee and W. C. Woo : What is a storm surge?
https://www.hko.gov.hk/education/article_e.htm?title=ele_00168
[4] M. C. Ng : Know more about Storm Surge
https://www.hko.gov.hk/education/article_e.htm?title=ele_00444
[5] K. W. Li : Know more about Tides
https://www.hko.gov.hk/education/edu01met/wxphe/ele_tide.htm
Up till now (29 October 2018), including Mangkhut, there are in total 16 typhoons that necessitated the issuance of the Hurricane Signal No. 10 (Note 1) in Hong Kong since World War II. This article will concisely review the wind strength, storm surge and rainfall brought by Mangkhut to see how ferocious Mangkhut was as compared to other "Signal No. 10" typhoons in the past.
Figure 1 Reports of interruption of power and water supply under the influence of Mangkhut based on news and social media. The incident reports are not exhaustive.
Figure 2 Maximum sea level (metres above Chart Datum) recorded at various tide gauges in Hong Kong and flood reports from government departments, news and social media on 16 September 2018. The flood reports are not exhaustive.
Maximum Intensity of the Storm
Mangkhut reached its peak intensity before making landfall over Luzon on 14 September 2018, with a maximum sustained wind of 250 km/h (10-minute average). By comparing the maximum intensity in the whole storm life cycle, it is the strongest among the 16 "Signal No. 10" typhoons, even exceeding Hope in 1979 (Table 1). Mangkhut then moved across the northern part of Luzon and weakened under the influence of terrain. After entering the South China Sea, Mangkhut maintained a marginal super typhoon strength and further weakened into a severe typhoon when it came close to Hong Kong. If the track of Mangkhut shifted slightly northwards and entered the South China Sea through the Luzon Strait, its intensity when approaching Hong Kong would likely be stronger than what it was on that day.
Table 1 A comparison of Super Typhoon Mangkhut and other typhoons necessitating the issuance of the Hurricane Signal No. 10.
Winds over Hong Kong
Present analysis showed that Mangkhut passed about 100 km south-southwest of Hong Kong. Together with Vicente, they are both the farthest "Signal No.10" typhoons (Table 1). In terms of the overall wind strength over Hong Kong, Mangkhut is indeed one of the top notches among the "Signal No. 10" typhoons (Table 2), and is far stronger than York, Vicente, and Hato in recent years. The maximum 60-minute mean wind speeds recorded at Waglan Island and Cheung Chau were 161 km/h and 157 km/h respectively during the passage of Mangkhut. Both are the second highest records at the corresponding stations, just lower than the record high of Ellen in 1983 and exceeding the records of other historical typhoons in Hong Kong such as Wanda (1962), Rose (1971) and Hope (1979). Gusts over 150 km/h were registered in most parts of the territory during the day and a maximum gust of 256 km/h was recorded at Tate's Cairn, ranking after Wanda (1962) and Ruby (1964) as the third highest for that station.
Table 2 Maximum 60-min mean wind speeds and maximum gust during the passages of typhoons necessitating the issuance of the Hurricane Signal No. 10.
Winds over Hong Kong were stronger than places like Macao, Zhuhai and Taishan during the passage of Mangkhut. One might ask why the winds were stronger over Hong Kong which was further away from the centre of Mangkhut as compared with these places. To address this question, let's first take a look at the wind structure of a tropical cyclone. In general, the highest winds are confined to the eyewall, a ring of intense rainband around the eye in a mature typhoon [1]. The microwave image of Mangkhut before it crossed Luzon clearly depicted the intense convection at the eyewall and its typical wind structure (Figure 3). After Mangkhut passed the northern part of Luzon, its intensity weakened owing to the interaction with land. Although the eyewall rebuilt when it traversed the northern part of the South China Sea, the convection of the eyewall was significantly weaker than that before crossing Luzon. On the contrary, the convection of the spiral rainband outside the eyewall remained intense and the structure was intact.
As Mangkhut skirted to the south-southwest of Hong Kong on 16 September 2018, radar pictures showed that the intense spiral rainband between 100 and 200 kilometres from its centre swept across Hong Kong during the day. On the other hand, the convection over the eyewall which was close to the centre was significantly weaker (Figure 4). Moreover, Mangkhut moved rapidly west-northwestwards across the northern part of the South China Sea with a speed once reaching 35 km/h (six-hour average), ranking the second fastest among the Signal No.10 typhoons and just after the 42 km/h of Hope in 1979. With Hong Kong staying in the right semicircle of the storm (the dangerous semicircle [2]) for a long time, the superposition of wind speed and moving speed of the storm brought destructive winds to Hong Kong most of the time during the day. Present analysis also showed that the wind speeds registered by Huangmao Zhou anemometer, which was affected by the eyewall of Mangkhut, were lower than those of Waglan Island and Cheung Chau which were further away from Mangkhut (Figure 5). Analysis of microwave image (Figure 3), radar image (Figure 4) and surface observations revealed that, when Mangkhut traversed the South China Sea and was close to the Pearl River Estuary, the winds over the spiral rainband outside the eyewall were stronger than those at the eyewall. As a result, the wind strength experienced by Hong Kong was stronger than places like Macao, Zhuhai and Taishan.
In gist, although Mangkhut weakened slightly into a severe typhoon near Hong Kong on the morning of 16 September with a maximum wind of 175 km/h (10-minute average), slightly lower than Super Typhoon Hato (185 km/h) last year, due to Mangkhut's extensive circulation (Figures 6 and 7), fast movement and special wind structure, Hong Kong was persistently affected by the most violent and destructive spiral rainband of Mangkhut on that day. Maximum 10-minute average wind speeds over 170 km/h were registered at some offshore areas. The automatic weather station under testing at Clear Water Bay even recorded a maximum 10-minute average wind speed of 191 km/h (Note 2), which is believed to be the highest record (except high grounds) since the Observatory's commencement of automatic weather station installation in Hong Kong in the 1980s.
Figure 3 Change of wind structure of Mangkhut before crossing Luzon and over the northern part of the South China Sea.
Figure 4 (Top panel) Radar imagery of Mangkhut at 10 a.m. on 16 September 2018, with the intense spiral rainband outside the eye wall of Mangkhut affecting Hong Kong (highlighted in black). On the contrary, convection was significantly weaker near the centre of Mangkhut (red circle). (Bottom panel) Radar imagery of Hato at 8 a.m. on 23 August 2017. The convection near the centre of Hato (red circle) was much more intense than that of Mangkhut.
Figure 5 Track of Mangkhut near Hong Kong
Figure 6 (Left panel) Visible satellite imagery of Mangkhut at 11 a.m. on 16 September 2018. (Right panel) Visible satellite imagery of Hato at 11 a.m. on 23 August 2017 (on same scale). The circulation and convective clouds of Mangkhut are much more extensive than those of Hato.
Figure 7 (Left panel) Weather chart of Mangkhut at 2 p.m. on 16 September 2018. (Right panel) Weather chart of Wanda at 3 p.m. (Summer Time) on 1 September 1962 (on same scale). While both Mangkhut and Wanda were large storms, the outermost closed isobar of Mangkhut was slightly larger than that of Wanda.
Storm Surge
Mangkhut's track is a typical one causing severe storm surge in Hong Kong [3]. With the storm skirting past to the south-southwest of Hong Kong, the associated ferocious east and southeasterly winds pushed water towards the shore and piled up against the coast. In addition, Mangkhut's extensive circulation drove a more extensive area of the ocean which in turn raised the water level further [4]. The severe storm surge (the increase of water level by the storm) induced by Mangkhut raised the water level in Hong Kong generally by more than 2 metres, leading to substantial inundation of many low-lying areas along the coast of Hong Kong. Record-breaking storm surge was also recorded in many parts of the territory. The maximum storm surge registered at Quarry Bay inside the Victoria Harbour and Tai Po Kau inside the Tolo Harbour were both the highest since instrumental records began at these stations, exceeding Hagupit (2008), Hato (2017), and even Hope (1979) and Wanda (1962) (Tables 3 and 4).
The sea level (the sum of astronomical tide and storm surge, Figure 8) of Quarry Bay rose to a maximum of 3.88 metres (above Chart Datum, same below), exceeding the 3.57 metres registered during the passage of Hato in 2017, and only lower than the record high of 3.96 metres set by Wanda in 1962. A maximum water level of 4.71 metres was recorded at Tai Po Kau, also only lower than the record high of 5.03 metres set by Wanda.
The day Mangkhut hit Hong Kong fell on the seventh day of the eighth month of the lunar calendar, which was close to a neap tide day. Should Mangkhut have hit Hong Kong during the spring tide like what happened during the passage of Hato in 2017, the maximum water level inside the Victoria Harbour and Tolo Harbour would be close to 4.9 metres and 5.9 metres respectively (assuming an astronomical high tide of 2.5 metres), or about one metre higher than the current record and would definitely lead to more substantial damages!
Figure 8 Relationship between sea level, astronomical tide and storm surge.
Table 3 Maximum sea level and storm surge recorded at Quarry Bay/North Point during the passage of tropical cyclones (since 1954).
Table 4 Maximum sea level and storm surge recorded at Tai Po Kau during the passage of tropical cyclones (since 1962).
Rainfall
More than 150 millimetres of rainfall were recorded generally over Hong Kong on the day when Mangkhut hit Hong Kong, which ranks in the middle among the "Signal No. 10" typhoons (Table 5). In particular, 167.5 millimetres of rainfall were recorded at the Hong Kong Observatory Headquarters on that day, nearly 100 millimetres more than that when Hato struck Hong Kong last year. As regards the total rainfall brought by a tropical cyclone (Note 3), Mangkhut merely brought 180.7 millimetres of rainfall to Hong Kong. The wettest tropical cyclone in Hong Kong since 1884 is Typhoon Sam in August 1999. Even though Sam only necessitated the issuance of Signal No. 8 in Hong Kong, its circulation together with its trailing southwesterly winds brought torrential rain to Hong Kong during its passage and the following three days. The total rainfall recorded at the Hong Kong Observatory Headquarters amounted to 616.5 millimetres, which is about 43% higher than the normal value in August (Note 4).
Table 5 Daily rainfall recorded at the Hong Kong Observatory Headquarters during the passages of Mangkhut and other typhoons necessitating the issuance of the Hurricane Signal No. 10. The day when the Hurricane Signal No. 10 was issued, as well as the day before and after, are considered.
Concluding remarks
The widespread destruction in Hong Kong brought by Mangkhut is the most serious in the recent three decades. As a result of global warming, a warming ocean will provide more energy to fuel the storms in the future. The number of intense tropical cyclones and the associated precipitation rate will increase. Sea level rise caused by global warming will raise the frequency and threat of severe storm surge. Mangkhut is indeed a wake-up call for many of us, reminding us the powerful force of nature and the challenges of climate change. We must stay vigilant and be fully prepared to face the even bigger threats of tropical cyclones and extreme weather in the future.
CHOY Chun-wing and WU Man-chi
Notes:
1. Hurricane Signal No. 10 has been the highest tropical cyclone warning signal in Hong Kong since 1931. During the period between 1917 and 1930, Signal No. 7 was the highest tropical cyclone warning signal in Hong Kong, signifying hurricane force winds in Hong Kong.
2. The automatic weather station at Clear Water Bay is located on a complex terrain with the anemometer at an elevation over 70 metres above sea level. The corresponding wind speed near sea level is estimated to be lower than 185 km/h.
3. The rainfall brought by a tropical cyclone is defined as the total rainfall recorded at the Hong Kong Observatory Headquarters from the time when a tropical cyclone comes within 600 km of Hong Kong to 72 hours after it has dissipated or moved outside 600 km range of Hong Kong.
4. Climatological normal rainfall (1981 - 2010) in August is 432.2 millimetres.
Reference:
[1] C. C. Chan : Structure of Typhoons
https://www.hko.gov.hk/education/edu01met/01met_tropical_cyclones/ele_typhoon_e.htm
[2] W. Kong : Tropical Cyclone : To the East, To the West?
https://www.hko.gov.hk/blog/en/archives/00000103.htm
[3] B. Y. Lee and W. C. Woo : What is a storm surge?
https://www.hko.gov.hk/education/article_e.htm?title=ele_00168
[4] M. C. Ng : Know more about Storm Surge
https://www.hko.gov.hk/education/article_e.htm?title=ele_00444
[5] K. W. Li : Know more about Tides
https://www.hko.gov.hk/education/edu01met/wxphe/ele_tide.htm