Point of No Return
9 June 2014
Shortly after the Intergovernmental Panel on Climate Change (IPCC) released its Fifth Assessment Report (AR5) in September 2013, a survey of expert assessment of future sea level rise was published in a scientific journal. The survey asked researchers most active in the field to give estimates of sea level rise by 2100 and 2300. A total of 90 experts responded to the survey and most of them suggested that IPCC projections might be on the conservative side.
The US National Aeronautics and Space Administration (NASA) in May 2014 also announced the results of a landmark study that found the glacier loss in the Amundsen Sea sector (Figure 1) of West Antarctica had passed the point of no return[1]. According to the study, these glaciers are sufficient to cause a significant global sea level rise of around 1.2 metres if they all melt away. Although it is difficult to put a timescale on the total collapse, researchers thought it could happen within just a couple of centuries. The global mean sea level rise at the end of this century should therefore lean towards the high side of IPCC's projected range (Figure 2).
As the world still seems to insist on lurching down the high greenhouse gas concentration pathway, it may not be possible to reverse the warming climate within a short period of time. Unless strong and immediate mitigating actions are taken to prevent further collapse of glaciers in Antarctica, glaciers holding much more water in East Antarctica will eventually also drain into the oceans. The resultant scenario of a global sea level rise will displace inhabitants along the coastal regions and accentuate the threat of storm surges brought by cyclones. Hong Kong as one of the major coastal cities in the world will not be immune from such effects. A rare extreme sea level event today will then become more frequent or even routine in the future.
S M Lee and H W Tong
Reference:
[1] West Antarctic Glacier Loss Appears Unstoppable
www.jpl.nasa.gov/news/news.php?release=2014-148
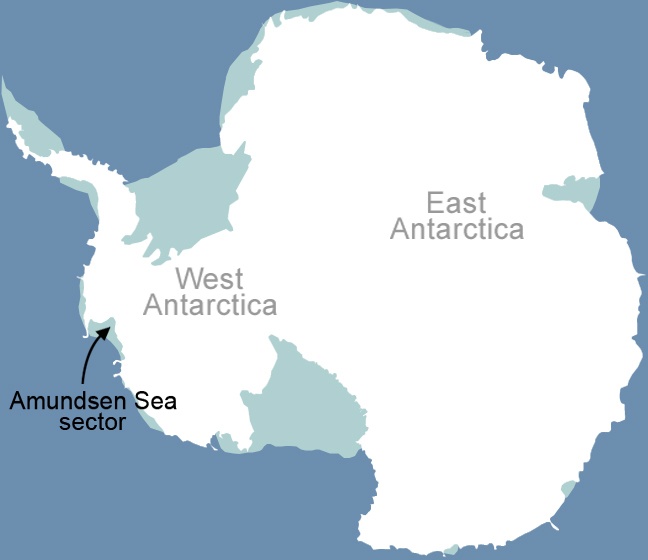
Figure 1Amundsen Sea sector on the west coast of Antarctica. (Source: NASA)
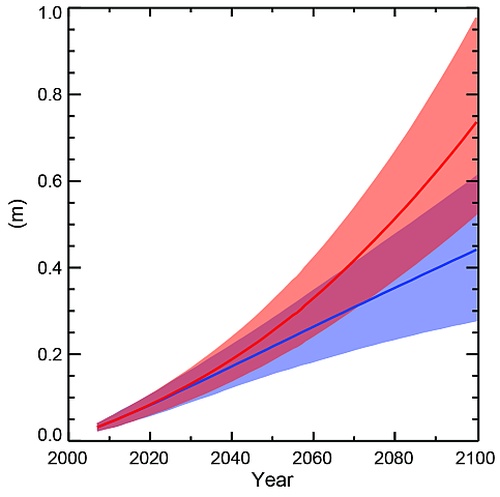
Figure 2IPCC projections of global mean sea level rise over the 21st century relative to the average of
1986-2005. Red (blue) represents high (low) greenhouse gas concentration scenario.
Solid line and colour-shaded area represent the median and likely range of the
projection respectively. (Source: IPCC)
The US National Aeronautics and Space Administration (NASA) in May 2014 also announced the results of a landmark study that found the glacier loss in the Amundsen Sea sector (Figure 1) of West Antarctica had passed the point of no return[1]. According to the study, these glaciers are sufficient to cause a significant global sea level rise of around 1.2 metres if they all melt away. Although it is difficult to put a timescale on the total collapse, researchers thought it could happen within just a couple of centuries. The global mean sea level rise at the end of this century should therefore lean towards the high side of IPCC's projected range (Figure 2).
As the world still seems to insist on lurching down the high greenhouse gas concentration pathway, it may not be possible to reverse the warming climate within a short period of time. Unless strong and immediate mitigating actions are taken to prevent further collapse of glaciers in Antarctica, glaciers holding much more water in East Antarctica will eventually also drain into the oceans. The resultant scenario of a global sea level rise will displace inhabitants along the coastal regions and accentuate the threat of storm surges brought by cyclones. Hong Kong as one of the major coastal cities in the world will not be immune from such effects. A rare extreme sea level event today will then become more frequent or even routine in the future.
S M Lee and H W Tong
Reference:
[1] West Antarctic Glacier Loss Appears Unstoppable
www.jpl.nasa.gov/news/news.php?release=2014-148
Figure 1Amundsen Sea sector on the west coast of Antarctica. (Source: NASA)
Figure 2IPCC projections of global mean sea level rise over the 21st century relative to the average of
1986-2005. Red (blue) represents high (low) greenhouse gas concentration scenario.
Solid line and colour-shaded area represent the median and likely range of the
projection respectively. (Source: IPCC)